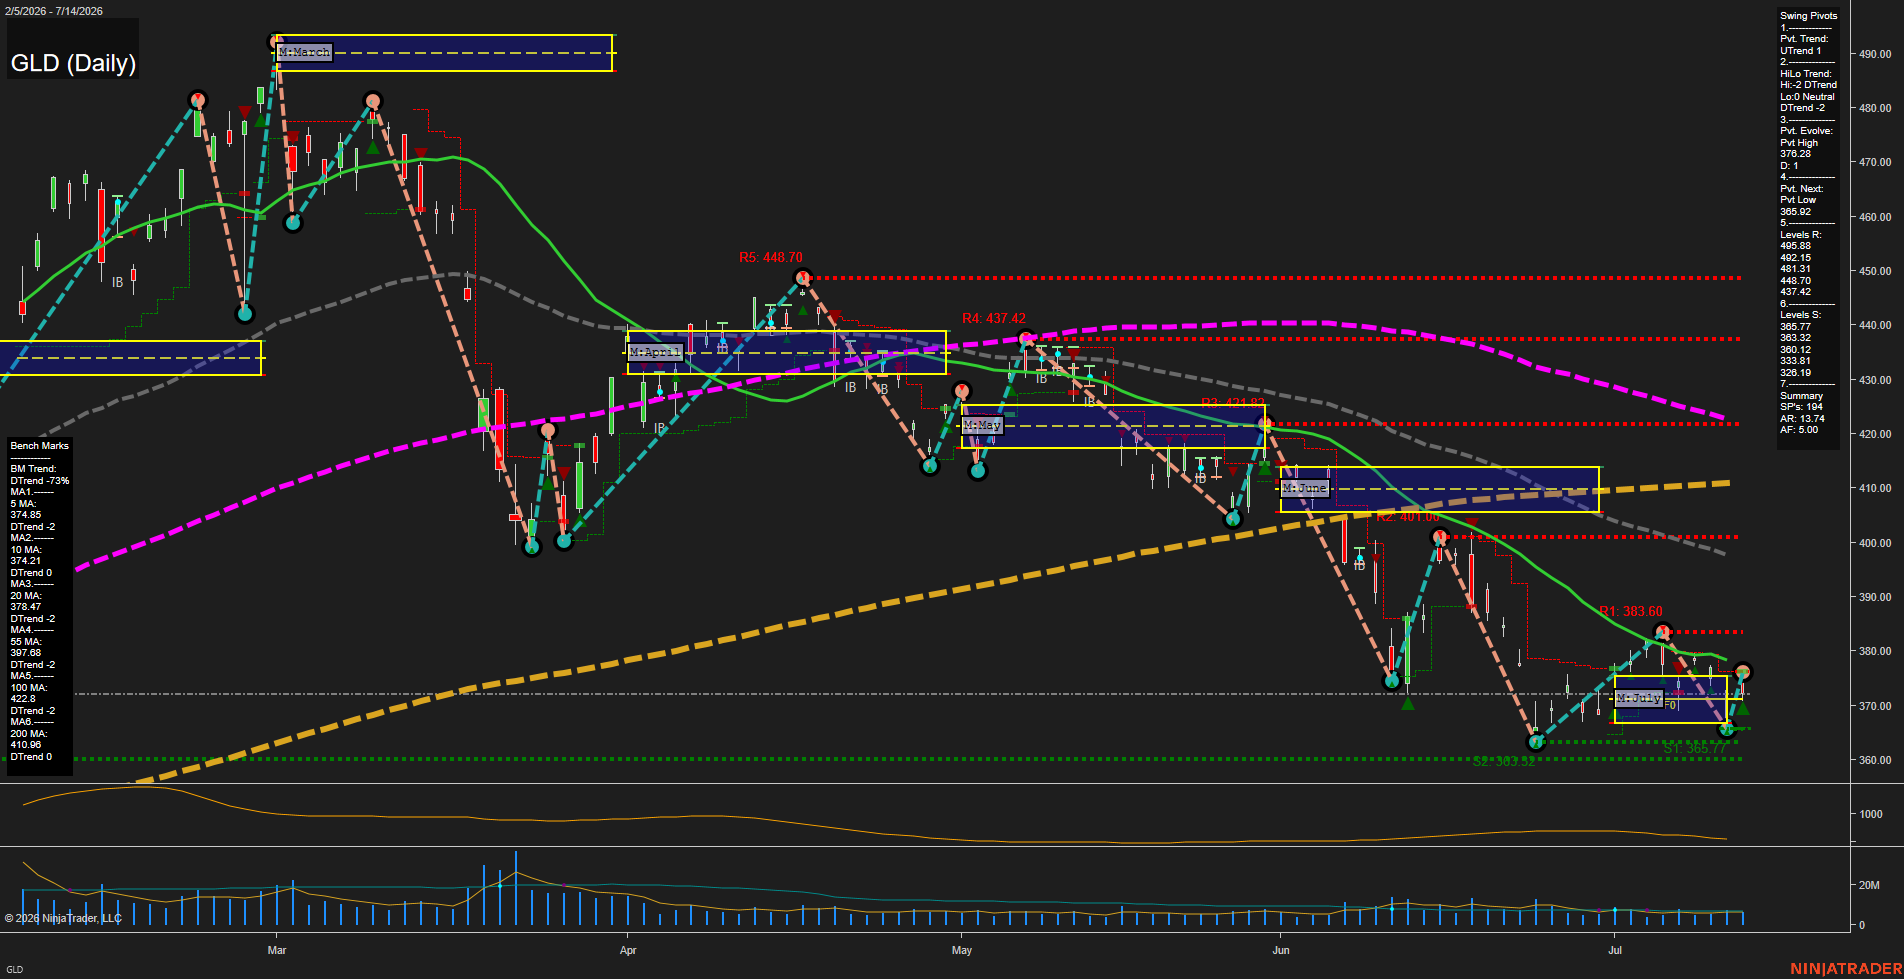
GLD SPDR Gold Shares Daily Chart Analysis: 2026-Jul-15 07:04 CT
Price Action
- Last: 374.35,
- Bars: Large,
- Mom: Fast.
WSFG Weekly
- Short-Term
- WSFG Current: NA%
- F0%/NTZ' Bias: Price Neutral,
- WSFG Trend: Neutral.
MSFG Month Jul
- Intermediate-Term
- MSFG Current: NA%
- F0%/NTZ' Bias: Price Neutral,
- MSFG Trend: Neutral.
YSFG Year 2026
- Long-Term
- YSFG Current: NA%
- F0%/NTZ' Bias: Price Neutral,
- YSFG Trend: Neutral.
Swing Pivots
- (Short-Term) 1. Pvt. Trend: DTrend,
- (Intermediate-Term) 2. HiLo Trend: DTrend,
- 3. Pvt. Evolve: Pvt High 376.28,
- 4. Pvt. Next: Pvt Low 365.92,
- 5. Levels R: 495.88, 492.15, 481.31, 448.70, 437.42,
- 6. Levels S: 385.77, 365.77, 363.32, 360.12, 333.81.
Daily Benchmarks
- (Short-Term) 5 Day: 374.35 Down Trend,
- (Short-Term) 10 Day: 374.21 Down Trend,
- (Intermediate-Term) 20 Day: 378.47 Down Trend,
- (Intermediate-Term) 55 Day: 397.68 Down Trend,
- (Long-Term) 100 Day: 422.80 Down Trend,
- (Long-Term) 200 Day: 410.06 Down Trend.
Additional Metrics
- ATR: 159,
- VOLMA: 7207880.
Overall Rating
- Short-Term: Bearish,
- Intermediate-Term: Bearish,
- Long-Term: Bearish.
Key Insights Summary
GLD is in a mature downside swing with price trading below all major daily benchmarks and the pivot structure still favoring lower highs and lower lows. The latest action is a sharp selloff followed by a rebound attempt, but the rebound is sitting under declining short-term averages and beneath the prior pivot resistance band, keeping the daily tape technically weak. The swing pivot map shows the short-term pivot trend still down while the intermediate HiLo structure also remains down, with overhead resistance clustered near 376.28, 383.60, 401.00, and 421.82. Support is layered below at 365.77, 363.32, 360.12, and then lower historical shelves, reflecting a market that is still digesting a prior trend break rather than forming a confirmed recovery. Volume has been lighter than the prior expansion phase while ATR remains elevated, consistent with a volatile consolidation after a trend leg. The broader read is a bearish-to-distribution structure with countertrend bounces occurring inside a larger corrective decline.
Chart Analysis ATS AI Generated: 2026-07-15 07:04 for Informational use only, not trading advice. Terms and Risk Disclosure Copyright © 2026. Algo Trading Systems LLC.