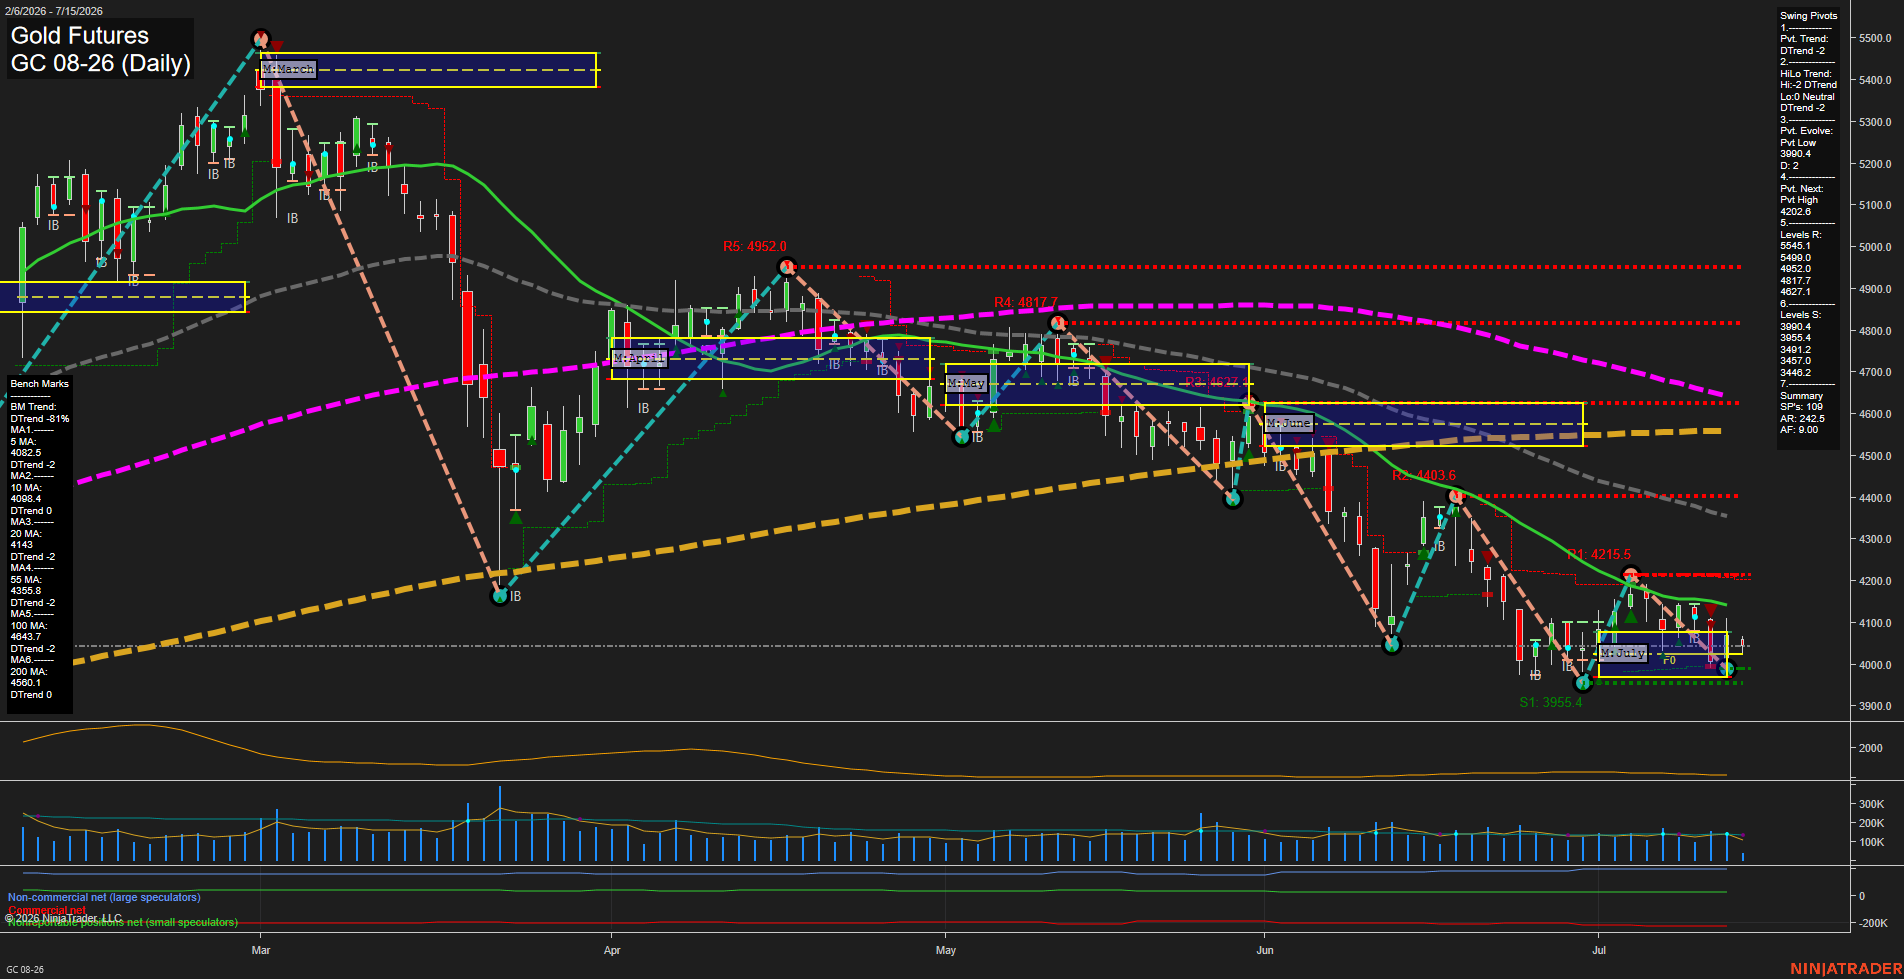
GC Gold Futures Daily Chart Analysis: 2026-Jul-15 07:03 CT
Price Action
- Last: 4035.0,
- Bars: Large,
- Mom: fast.
WSFG Weekly
- Short-Term
- WSFG Current: -26%
- F0%/NTZ' Bias: Price Below,
- WSFG Trend: Down.
MSFG Month Jul
- Intermediate-Term
- MSFG Current: 9%
- F0%/NTZ' Bias: Price Above,
- MSFG Trend: Up.
YSFG Year 2026
- Long-Term
- YSFG Current: -121%
- F0%/NTZ' Bias: Price Below,
- YSFG Trend: Down.
Swing Pivots
- (Short-Term) 1. Pvt. Trend: DTrend,
- (Intermediate-Term) 2. HiLo Trend: DTrend,
- 3. Pvt. Evolve: Pvt Low 3990.4,
- 4. Pvt. Next: Pvt High 4022.8,
- 5. Levels R: 5545.1, 5499.0, 4952.0, 4817.7, 4627.1,
- 6. Levels S: 3900.4, 3955.4, 3491.2, 3457.0, 3447.2.
Daily Benchmarks
- (Short-Term) 5 Day: 4082.5 Down Trend,
- (Short-Term) 10 Day: 4098.4 Down Trend,
- (Intermediate-Term) 20 Day: 4143.0 Down Trend,
- (Intermediate-Term) 55 Day: 4355.8 Down Trend,
- (Long-Term) 100 Day: 4643.7 Down Trend,
- (Long-Term) 200 Day: 4560.1 Down Trend.
Additional Metrics
- ATR: 242.5,
- VOLMA: 182966.
Recent Trade Signals
- 14 Jul 2026: Long GC 08-26 @ 4073.2 Signals.USAR.TR120
- 13 Jul 2026: Short GC 08-26 @ 4066.4 Signals.USAR-WSFG
- 10 Jul 2026: Long GC 08-26 @ 4122.4 Signals.USAR-MSFG
Overall Rating
- Short-Term: Bearish,
- Intermediate-Term: Bearish,
- Long-Term: Bearish.
Key Insights Summary
Gold futures are trading deep below the main benchmark moving-average stack, with the 5, 10, 20, 55, 100, and 200 day measures all sloping down and positioned overhead, confirming persistent downside structure. The daily swing pivot model is in DTrend, with the next pivot marked as a pivot high, while price remains pinned near the lower July session fib zone after a sharp selloff and bounce attempts. Weekly fib structure is below the NTZ midpoint, monthly structure remains slightly above its midpoint bias, and the yearly framework is still negative, reflecting a broader bearish backdrop despite short countertrend rebounds. Recent trade signals show alternating short-term reversal activity, but the dominant chart pattern is a lower-high, lower-low sequence with repeated rejection near prior resistance shelves and a late-month breakdown into the 3900-4050 area.
Chart Analysis ATS AI Generated: 2026-07-15 07:03 for Informational use only, not trading advice. Terms and Risk Disclosure Copyright © 2026. Algo Trading Systems LLC.