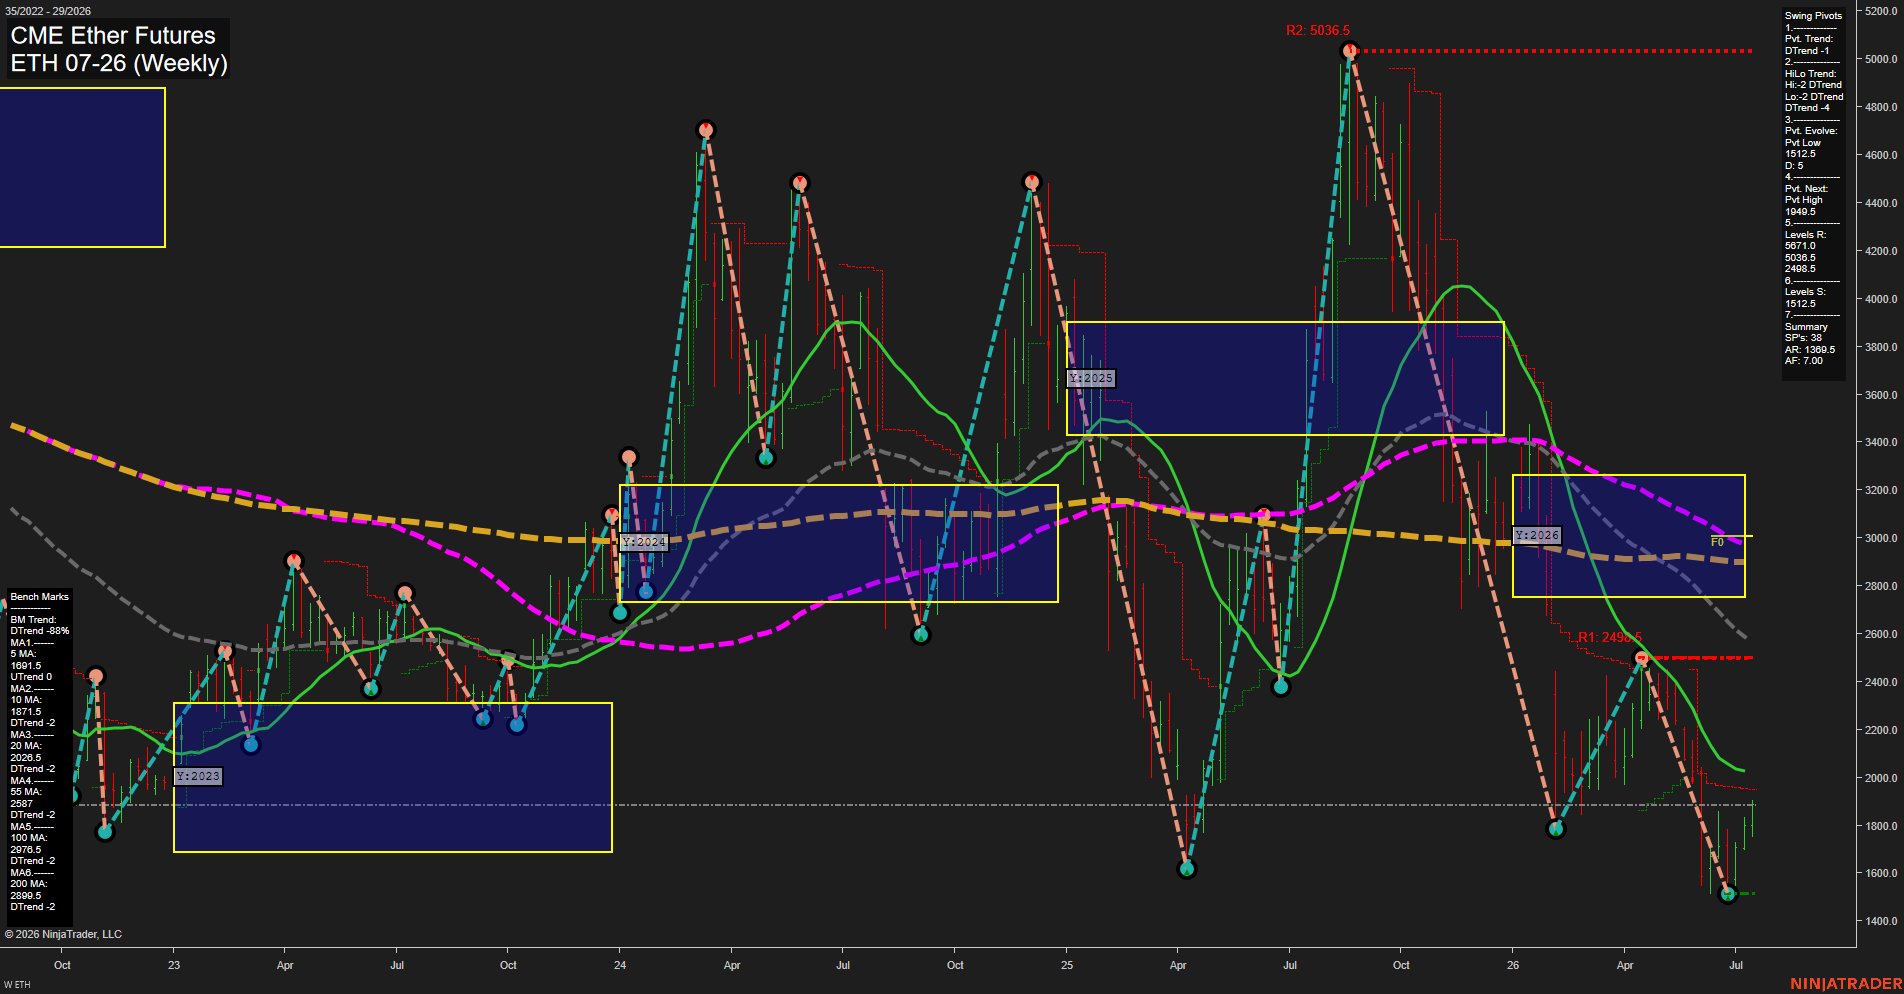
ETH CME Ether Futures Weekly Chart Analysis: 2026-Jul-15 07:03 CT
Price Action
- Last: 1850,
- Bars: Medium,
- Mom: Fast.
WSFG Weekly
- Short-Term
- WSFG Current: 37%
- F0%/NTZ' Bias: Price Above,
- WSFG Trend: Up.
MSFG Month Jul
- Intermediate-Term
- MSFG Current: 63%
- F0%/NTZ' Bias: Price Above,
- MSFG Trend: Up.
YSFG Year 2026
- Long-Term
- YSFG Current: -44%
- F0%/NTZ' Bias: Price Below,
- YSFG Trend: Down.
Swing Pivots
- (Short-Term) 1. Pvt. Trend: DTrend,
- (Intermediate-Term) 2. HiLo Trend: DTrend,
- 3. Pvt. Evolve: Pvt Low 1512.5,
- 4. Pvt. Next: Pvt High 1949.5,
- 5. Levels R: 5671.0, 5036.5, 2488.5,
- 6. Levels S: 1512.5.
Weekly Benchmarks
- (Short-Term) 5 Day: 1691.5 Up Trend,
- (Short-Term) 10 Day: 1871.5 Down Trend,
- (Intermediate-Term) 20 Day: 2026.5 Down Trend,
- (Intermediate-Term) 55 Day: 2587 Down Trend,
- (Long-Term) 100 Day: 2976.5 Down Trend,
- (Long-Term) 200 Day: 2888.5 Down Trend.
Recent Trade Signals
- 14 Jul 2026: Short ETH 07-26 @ 1786.5 Signals.USAR-WSFG
- 13 Jul 2026: Short ETH 07-26 @ 1785 Signals.USAR.TR120
Overall Rating
- Short-Term: Neutral,
- Intermediate-Term: Neutral,
- Long-Term: Bearish.
Key Insights Summary
Weekly structure shows a sharp rebound from the 2026 low into the 1800s, but the broader tape remains capped beneath the declining 10-day and all higher moving averages. The short-term WSFG is back above F0% with an upward bias, yet the pivot sequence still reads DTrend and the latest short signals confirm that the rally is occurring inside a larger corrective downswing. Monthly session structure is firmer than the weekly/benchmark backdrop, giving the intermediate picture a mixed, two-way feel, while the yearly grid stays below F0% and keeps the long-term tone bearish. The chart is in a recovery phase after a steep selloff, with resistance clustered near the next pivot high and prior swing levels, and support anchored near the recent pivot low.
Chart Analysis ATS AI Generated: 2026-07-15 07:03 for Informational use only, not trading advice. Terms and Risk Disclosure Copyright © 2026. Algo Trading Systems LLC.