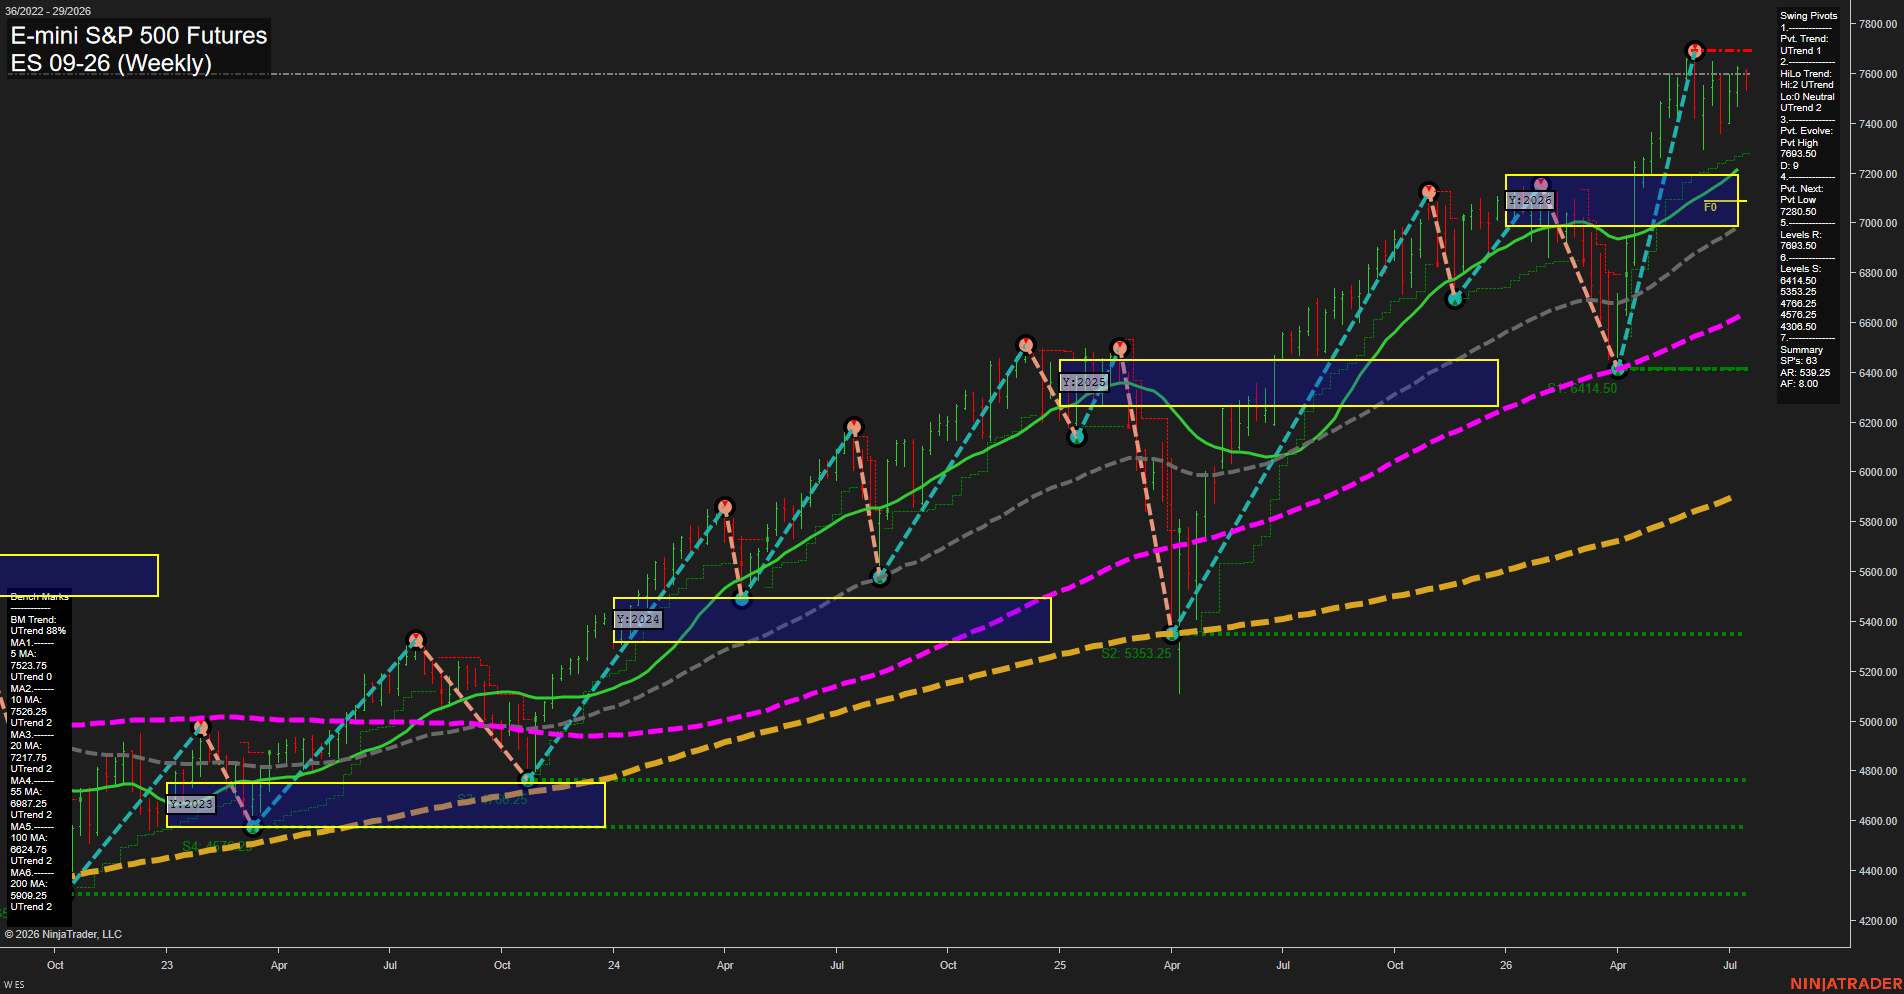
ES E-mini S&P 500 Futures Weekly Chart Analysis: 2026-Jul-15 07:02 CT
Price Action
- Last: 7600.00,
- Bars: Large,
- Mom: Fast.
WSFG Weekly
- Short-Term
- WSFG Current: -4%
- F0%/NTZ' Bias: Price Below,
- WSFG Trend: Down.
MSFG Month Jul
- Intermediate-Term
- MSFG Current: 13%
- F0%/NTZ' Bias: Price Above,
- MSFG Trend: Up.
YSFG Year 2026
- Long-Term
- YSFG Current: 49%
- F0%/NTZ' Bias: Price Above,
- YSFG Trend: Up.
Swing Pivots
- (Short-Term) 1. Pvt. Trend: UTrend,
- (Intermediate-Term) 2. HiLo Trend: UTrend,
- 3. Pvt. Evolve: Pvt High 7683.50,
- 4. Pvt. Next: Pvt Low 7280.50,
- 5. Levels R: 7693.50,
- 6. Levels S: 6441.50, 5353.25, 4766.25, 4576.25, 4306.50.
Weekly Benchmarks
- (Short-Term) 5 Day: 7523.75 Up Trend,
- (Short-Term) 10 Day: 7526.25 Up Trend,
- (Intermediate-Term) 20 Day: 7217.75 Up Trend,
- (Intermediate-Term) 55 Day: 6987.25 Up Trend,
- (Long-Term) 100 Day: 6824.75 Up Trend,
- (Long-Term) 200 Day: 5808.25 Up Trend.
Recent Trade Signals
- 15 Jul 2026: Long ES 09-26 @ 7609.25 Signals.USAR-MSFG
- 15 Jul 2026: Long ES 09-26 @ 7607.25 Signals.USAR.TR120
- 13 Jul 2026: Short ES 09-26 @ 7577.25 Signals.USAR-WSFG
Overall Rating
- Short-Term: Bearish,
- Intermediate-Term: Bullish,
- Long-Term: Bullish.
Key Insights Summary
Weekly price is pressing near the upper end of the 2026 yearly session structure after a sharp vertical advance and strong recovery from the spring pullback. Short-term structure remains mixed-to-bearish because the weekly session fib grid sits below F0% and the latest swing sequence shows a fresh pivot-high then a pivot-low setup, while intermediate and long-term structure stay firmly bullish with price holding above the month and year session midlines. The benchmark stack remains constructive, with all visible moving averages aligned in upward trends and price trading well above the 20, 55, 100, and 200 day references. The chart reflects a trend-with-pullback environment: strong rally legs, a deep countertrend washout in April, then renewed upside continuation into new highs, with recent bars showing consolidation beneath the peak after a breakout impulse.
Chart Analysis ATS AI Generated: 2026-07-15 07:02 for Informational use only, not trading advice. Terms and Risk Disclosure Copyright © 2026. Algo Trading Systems LLC.