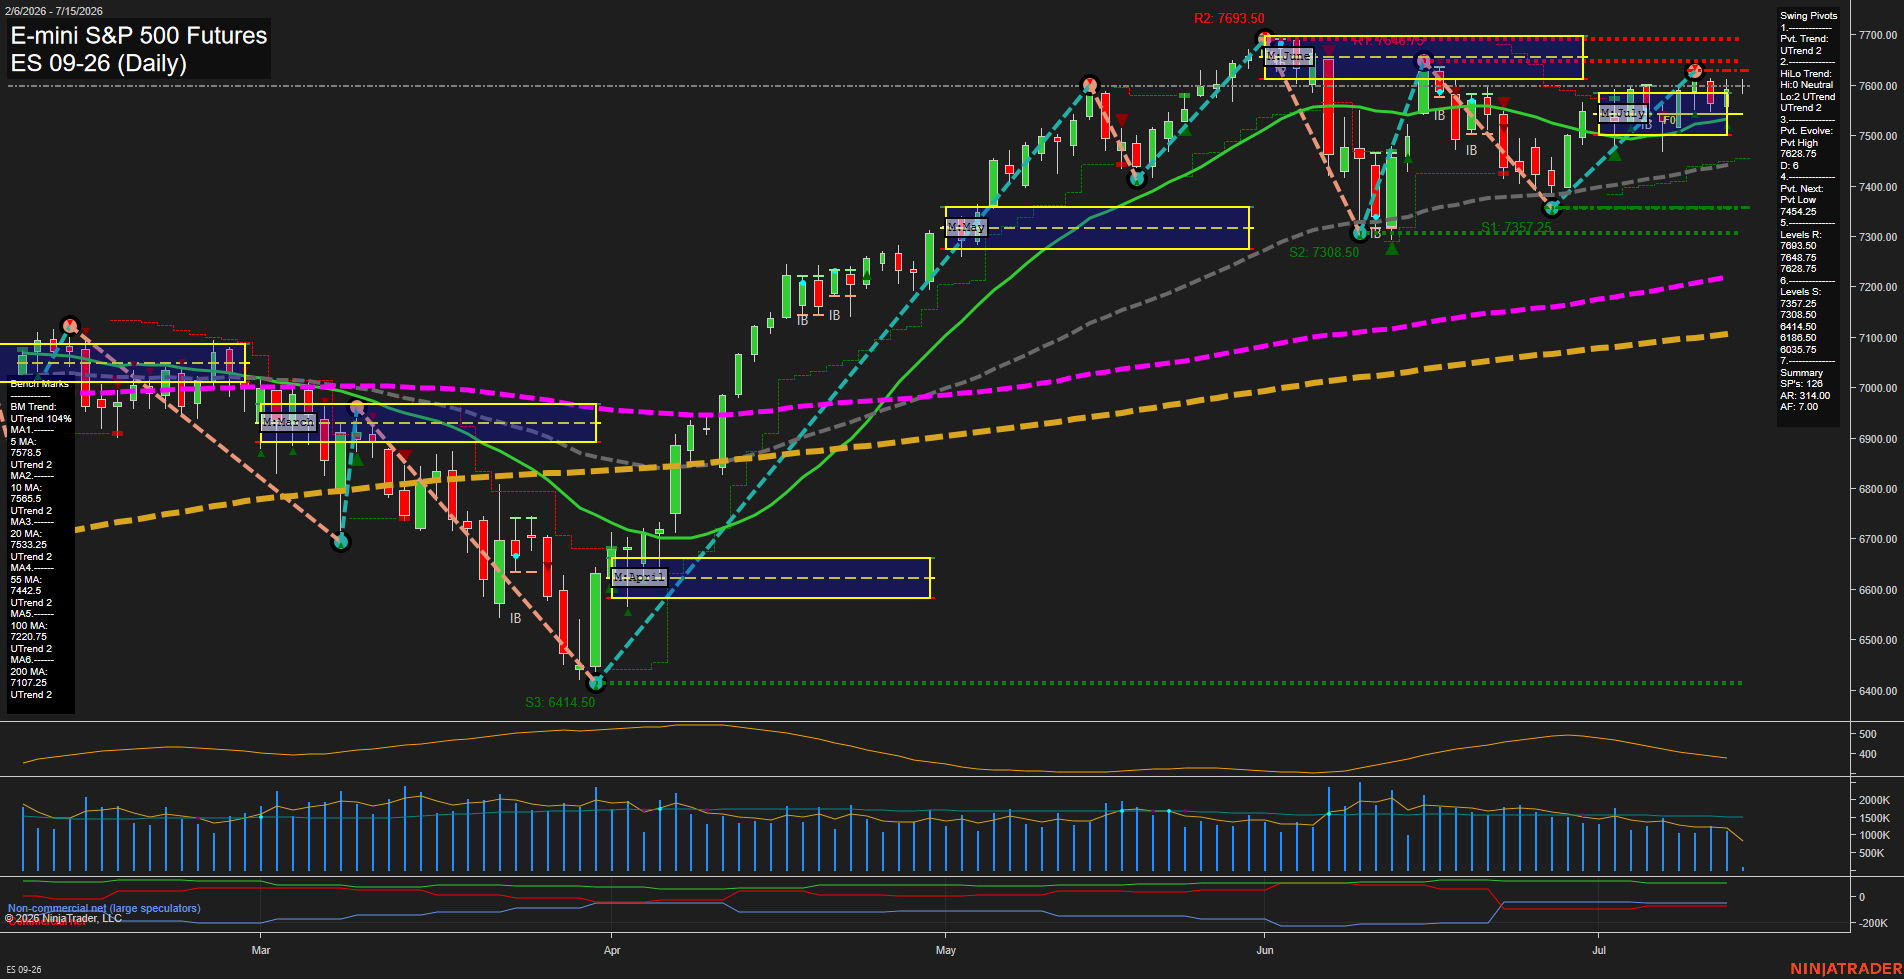
ES E-mini S&P 500 Futures Daily Chart Analysis: 2026-Jul-15 07:02 CT
Price Action
- Last: 7605.25,
- Bars: Medium,
- Mom: average.
WSFG Weekly
- Short-Term
- WSFG Current: -4%
- F0%/NTZ' Bias: Price Below,
- WSFG Trend: Down.
MSFG Month Jul
- Intermediate-Term
- MSFG Current: 13%
- F0%/NTZ' Bias: Price Above,
- MSFG Trend: Up.
YSFG Year 2026
- Long-Term
- YSFG Current: 49%
- F0%/NTZ' Bias: Price Above,
- YSFG Trend: Up.
Swing Pivots
- (Short-Term) 1. Pvt. Trend: UTrend,
- (Intermediate-Term) 2. HiLo Trend: UTrend,
- 3. Pvt. Evolve: Pvt Low 7545.25,
- 4. Pvt. Next: Pvt Low 7545.25,
- 5. Levels R: 7693.50, 7648.75, 7628.75,
- 6. Levels S: 7357.25, 7308.50, 6414.50.
Daily Benchmarks
- (Short-Term) 5 Day: 7578.5 Up Trend,
- (Short-Term) 10 Day: 7565.5 Up Trend,
- (Intermediate-Term) 20 Day: 7533.25 Up Trend,
- (Intermediate-Term) 55 Day: 7442.5 Up Trend,
- (Long-Term) 100 Day: 7220.75 Up Trend,
- (Long-Term) 200 Day: 7107.25 Up Trend.
Additional Metrics
- ATR: 319,
- VOLMA: 1611996.
Recent Trade Signals
- 15 Jul 2026: Long ES 09-26 @ 7609.25 Signals.USAR-MSFG
- 15 Jul 2026: Long ES 09-26 @ 7607.25 Signals.USAR.TR120
- 13 Jul 2026: Short ES 09-26 @ 7577.25 Signals.USAR-WSFG
Overall Rating
- Short-Term: Bullish,
- Intermediate-Term: Bullish,
- Long-Term: Bullish.
Key Insights Summary
Price is holding above the 5, 10, 20, 55, 100, and 200 day benchmarks, which keeps the broader daily structure firmly positive. The pivot sequence remains in an uptrend, with price trading near the upper part of the recent range after a strong recovery from the early-June pullback and the July test of support. Weekly structure is still below the weekly F0%/NTZ midpoint and trends down, so the shorter-cycle backdrop is mixed versus the stronger monthly and yearly posture. The daily tape shows a constructive advance with medium-sized bars and average momentum, while nearby resistance sits at 7628.75, 7648.75, and 7693.50; support is layered at 7545.25, 7357.25, and 7308.50. Recent signals show renewed long bias on the monthly and TR120 measures after the prior weekly short signal, reflecting a transition from the July dip back into the larger uptrend.
Chart Analysis ATS AI Generated: 2026-07-15 07:02 for Informational use only, not trading advice. Terms and Risk Disclosure Copyright © 2026. Algo Trading Systems LLC.