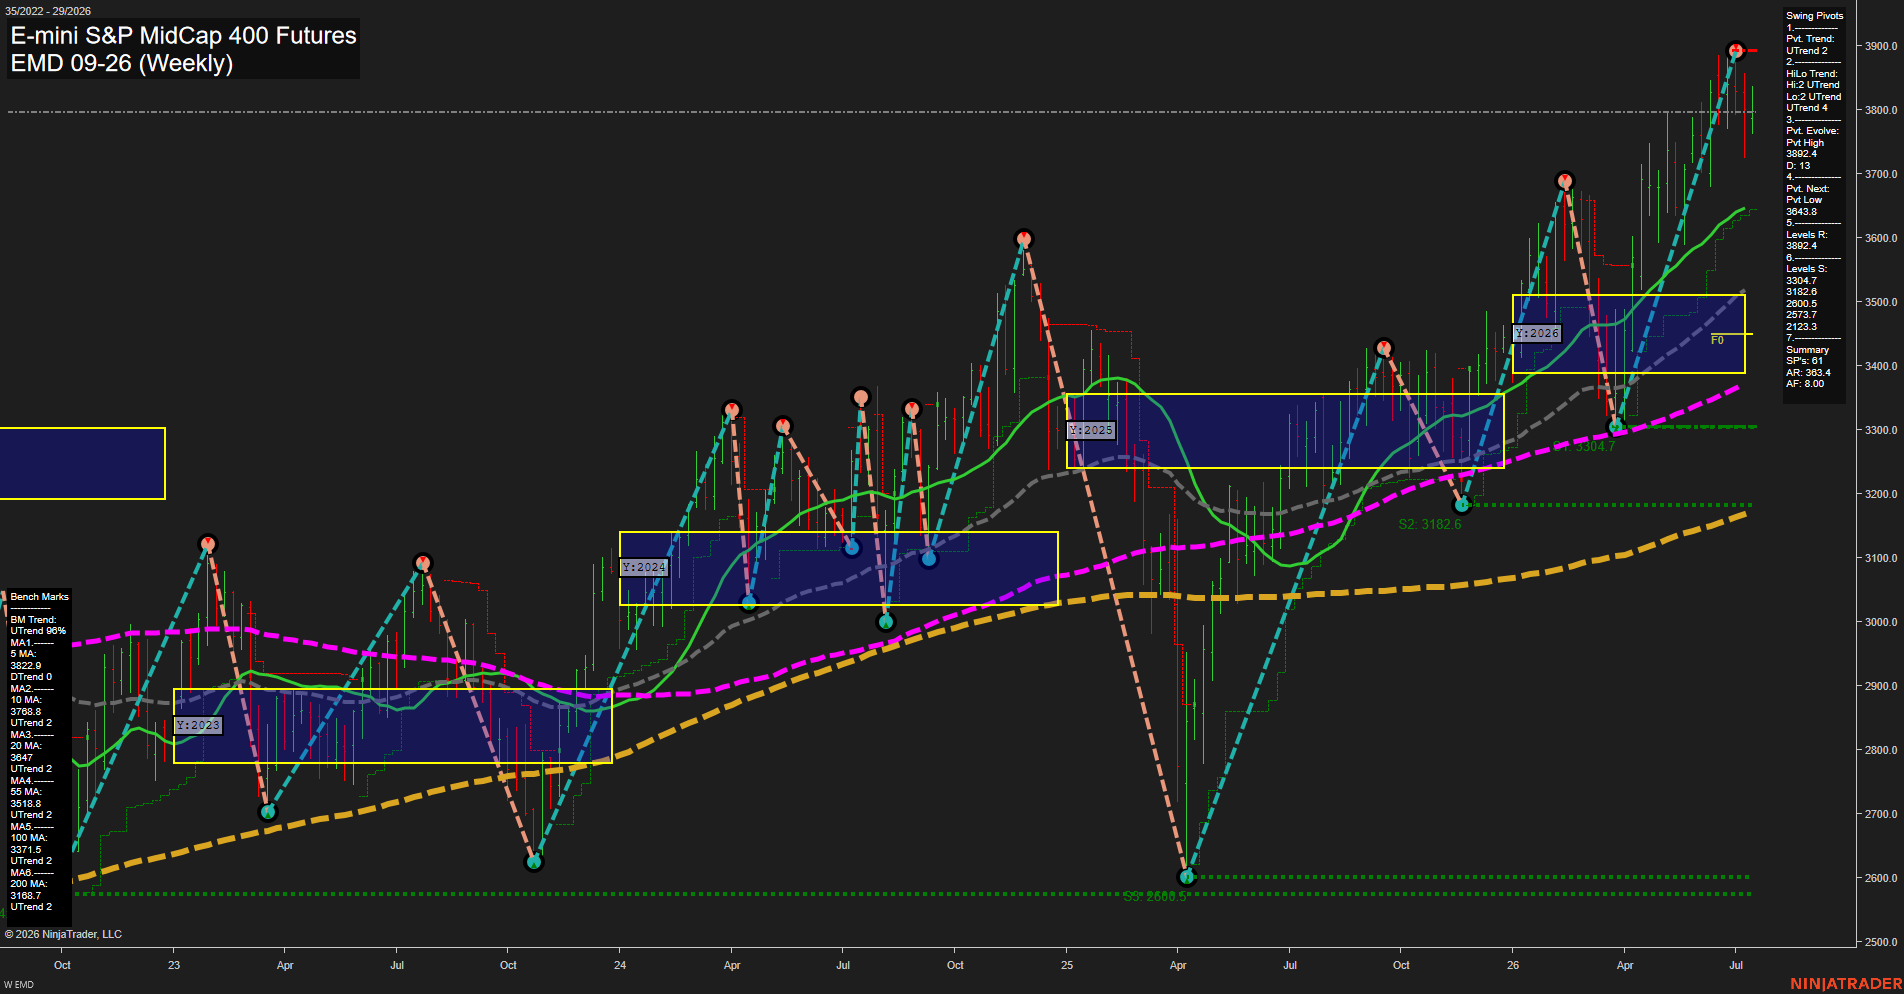
EMD E-mini S&P MidCap 400 Futures Weekly Chart Analysis: 2026-Jul-15 07:02 CT
Price Action
- Last: 3836.4,
- Bars: Large,
- Mom: fast.
WSFG Weekly
- Short-Term
- WSFG Current: 11%
- F0%/NTZ' Bias: Price Above,
- WSFG Trend: Up.
MSFG Month Jul
- Intermediate-Term
- MSFG Current: -31%
- F0%/NTZ' Bias: Price Below,
- MSFG Trend: Down.
YSFG Year 2026
- Long-Term
- YSFG Current: 57%
- F0%/NTZ' Bias: Price Above,
- YSFG Trend: Up.
Swing Pivots
- (Short-Term) 1. Pvt. Trend: UTrend,
- (Intermediate-Term) 2. HiLo Trend: UTrend,
- 3. Pvt. Evolve: Pvt High 3892.4,
- 4. Pvt. Next: Pvt Low 3643.8,
- 5. Levels R: 3892.4,
- 6. Levels S: 3304.7, 3182.6, 2600.5, 2573.7, 2123.3.
Weekly Benchmarks
- (Short-Term) 5 Day: 3822.9 Up Trend,
- (Short-Term) 10 Day: 3768.8 Up Trend,
- (Intermediate-Term) 20 Day: 3647.0 Up Trend,
- (Intermediate-Term) 55 Day: 3518.8 Up Trend,
- (Long-Term) 100 Day: 3371.5 Up Trend,
- (Long-Term) 200 Day: 3188.7 Up Trend.
Recent Trade Signals
- 14 Jul 2026: Long EMD 09-26 @ 3802.7 Signals.USAR-WSFG
- 09 Jul 2026: Long EMD 09-26 @ 3817.9 Signals.USAR.TR120
- 08 Jul 2026: Short EMD 09-26 @ 3726.4 Signals.USAR.TR720
Overall Rating
- Short-Term: Bullish,
- Intermediate-Term: Bearish,
- Long-Term: Bullish.
Key Insights Summary
Weekly price is pressing into the upper end of the 2026 yearly session fib grid with a strong upside impulse and a large-bar expansion off the prior pivot low. The swing structure remains constructive short term, with pivot trend and hi/lo trend both in UTrend, and the most recent signals shifting back to long alignment after the earlier short TR720 event. The monthly session fib grid is still in a negative position below its F0%/NTZ centerline, so the intermediate view remains mixed-to-bearish despite the broader uptrend. Benchmark moving averages are stacked positively and rising across the 5, 10, 20, 55, 100, and 200 day references, showing that the broader trend base is still firmly upward. The latest advance has been a sharp V-style recovery from the spring pivot low, followed by a breakout sequence that reclaimed prior resistance zones and pushed toward the 3892.4 pivot high area.
Chart Analysis ATS AI Generated: 2026-07-15 07:02 for Informational use only, not trading advice. Terms and Risk Disclosure Copyright © 2026. Algo Trading Systems LLC.