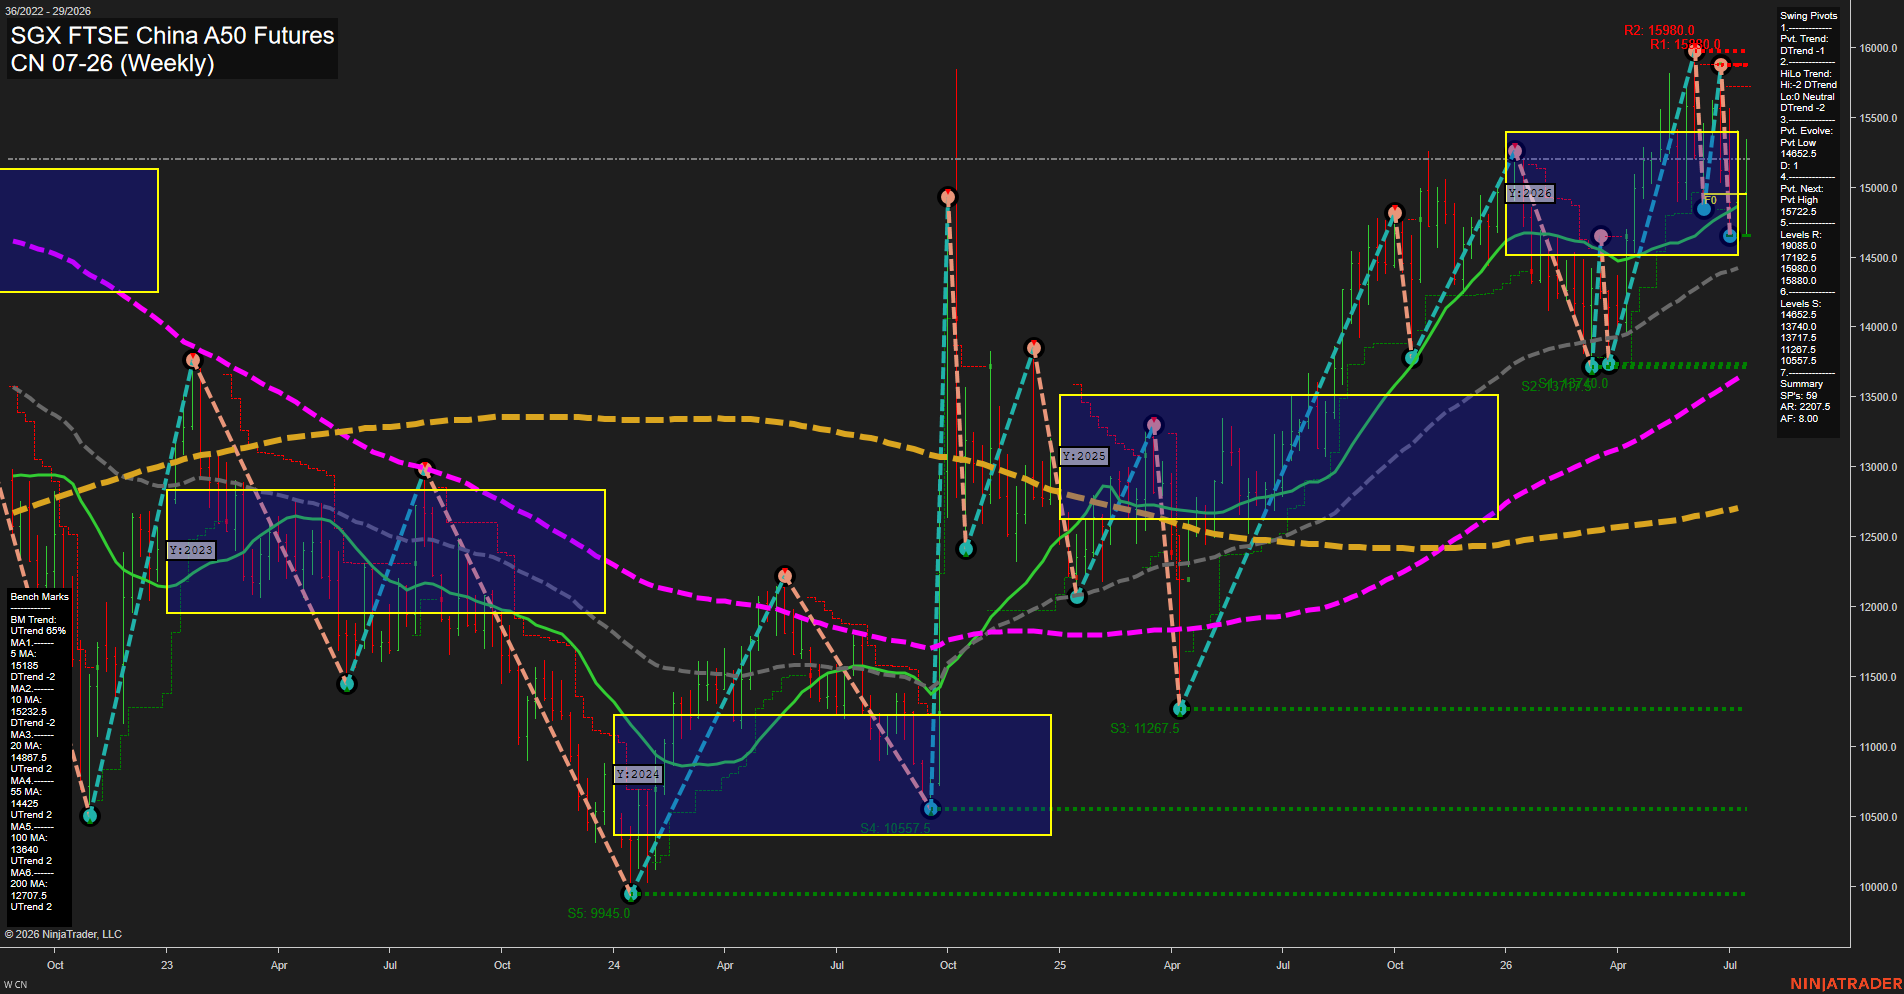
CN SGX FTSE China A50 Futures Weekly Chart Analysis: 2026-Jul-15 07:02 CT
Price Action
- Last: 15722.5,
- Bars: Large,
- Mom: fast.
WSFG Weekly
- Short-Term
- WSFG Current: NA%
- F0%/NTZ' Bias: Price Neutral,
- WSFG Trend: Neutral.
MSFG Month Jul
- Intermediate-Term
- MSFG Current: NA%
- F0%/NTZ' Bias: Price Neutral,
- MSFG Trend: Neutral.
YSFG Year 2026
- Long-Term
- YSFG Current: NA%
- F0%/NTZ' Bias: Price Neutral,
- YSFG Trend: Neutral.
Swing Pivots
- (Short-Term) 1. Pvt. Trend: DTrend,
- (Intermediate-Term) 2. HiLo Trend: DTrend,
- 3. Pvt. Evolve: Pvt Low 14652.5,
- 4. Pvt. Next: Pvt High 15722.5,
- 5. Levels R: 19085.0, 17192.5, 15980.0, 15880.0,
- 6. Levels S: 14652.5, 13740.0, 13717.5, 11287.5, 10557.5.
Weekly Benchmarks
- (Short-Term) 5 Day: 15185.0 Down Trend,
- (Short-Term) 10 Day: 15232.5 Down Trend,
- (Intermediate-Term) 20 Day: 14867.5 Up Trend,
- (Intermediate-Term) 55 Day: 14425.0 Up Trend,
- (Long-Term) 100 Day: 13640.0 Up Trend,
- (Long-Term) 200 Day: 12707.5 Up Trend.
Overall Rating
- Short-Term: Neutral,
- Intermediate-Term: Bullish,
- Long-Term: Bullish.
Key Insights Summary
The weekly structure shows a strong advance from the 2024 base and a continued 2025-2026 recovery trend, with price now pressing into the upper end of the yearly fib zone near 15,722.5. Short-term pivot structure remains in DTrend, reflecting a recent pullback or pause after the latest push higher, while the broader hi/lo pivot framework still supports the larger recovery sequence. The near-term benchmark averages are mixed to softer, but the 20, 55, 100, and 200 day benchmarks remain aligned upward, keeping the intermediate and long-term backdrop constructive. Price is trading close to overhead resistance markers around 15,880 to 15,980, with the next major historical ceiling higher up near 17,192.5 and 19,085.0. Overall, the chart reads as a strong long-duration uptrend with a short-term consolidation tone after an impulsive rally into resistance.
Chart Analysis ATS AI Generated: 2026-07-15 07:02 for Informational use only, not trading advice. Terms and Risk Disclosure Copyright © 2026. Algo Trading Systems LLC.