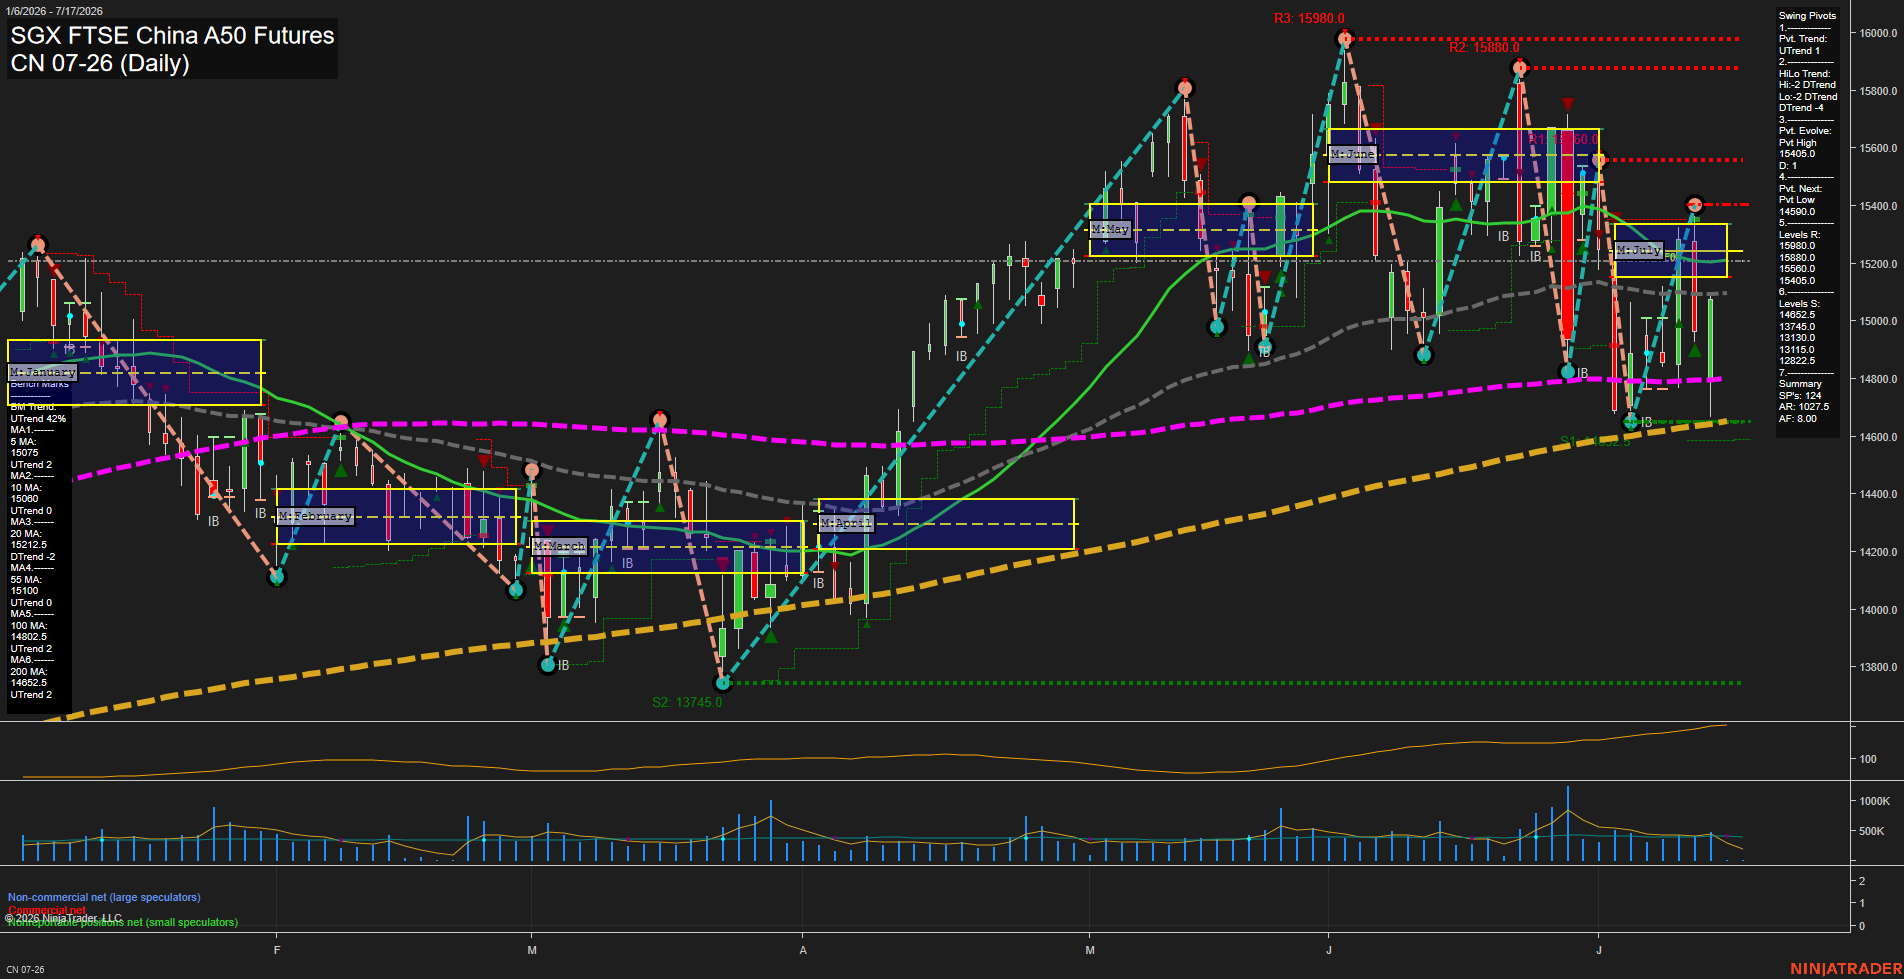
CN SGX FTSE China A50 Futures Daily Chart Analysis: 2026-Jul-15 07:02 CT
Price Action
- Last: 15540.0,
- Bars: Large,
- Mom: fast.
WSFG Weekly
- Short-Term
- WSFG Current: NA%
- F0%/NTZ' Bias: Price Neutral,
- WSFG Trend: Neutral.
MSFG Month Jul
- Intermediate-Term
- MSFG Current: NA%
- F0%/NTZ' Bias: Price Neutral,
- MSFG Trend: Neutral.
YSFG Year 2026
- Long-Term
- YSFG Current: NA%
- F0%/NTZ' Bias: Price Neutral,
- YSFG Trend: Neutral.
Swing Pivots
- (Short-Term) 1. Pvt. Trend: UTrend,
- (Intermediate-Term) 2. HiLo Trend: DTrend,
- 3. Pvt. Evolve: Pvt High 15405.0,
- 4. Pvt. Next: Pvt Low 14590.0,
- 5. Levels R: 15980.0, 15880.0, 15660.0, 15405.0,
- 6. Levels S: 14652.5, 13745.0, 13130.0, 13115.0, 12822.5.
Daily Benchmarks
- (Short-Term) 5 Day: 15075.0 Up Trend,
- (Short-Term) 10 Day: 15080.0 Up Trend,
- (Intermediate-Term) 20 Day: 15212.5 Down Trend,
- (Intermediate-Term) 55 Day: 15110.0 Up Trend,
- (Long-Term) 100 Day: 14802.5 Up Trend,
- (Long-Term) 200 Day: 14652.5 Up Trend.
Additional Metrics
- ATR: 87.5,
- VOLMA: 261842.
Overall Rating
- Short-Term: Neutral,
- Intermediate-Term: Bullish,
- Long-Term: Bullish.
Key Insights Summary
Price is trading in a broad multi-month recovery structure with fast momentum and a large daily bar footprint, but the recent action is still working through overhead supply near the 15660 to 15880 resistance band. Short-term swing pivots remain in an uptrend, while the intermediate HiLo structure is still negative, reflecting a market that has advanced sharply but remains inside a choppy two-way rotation zone. The daily benchmarks show near-term price action holding above the 5 and 10 day averages, while the 20 day remains below price, supporting a bullish longer swing tone with some near-term consolidation behavior. The 100 and 200 day averages are rising and positioned well below current trade, confirming a stronger long-term recovery profile. The current tape looks like a rally that has transitioned into a pause-and-test phase, with repeated inside-bar and rejection behavior around the upper pivot shelf before continuing to rotate higher within the larger uptrend.
Chart Analysis ATS AI Generated: 2026-07-15 07:02 for Informational use only, not trading advice. Terms and Risk Disclosure Copyright © 2026. Algo Trading Systems LLC.