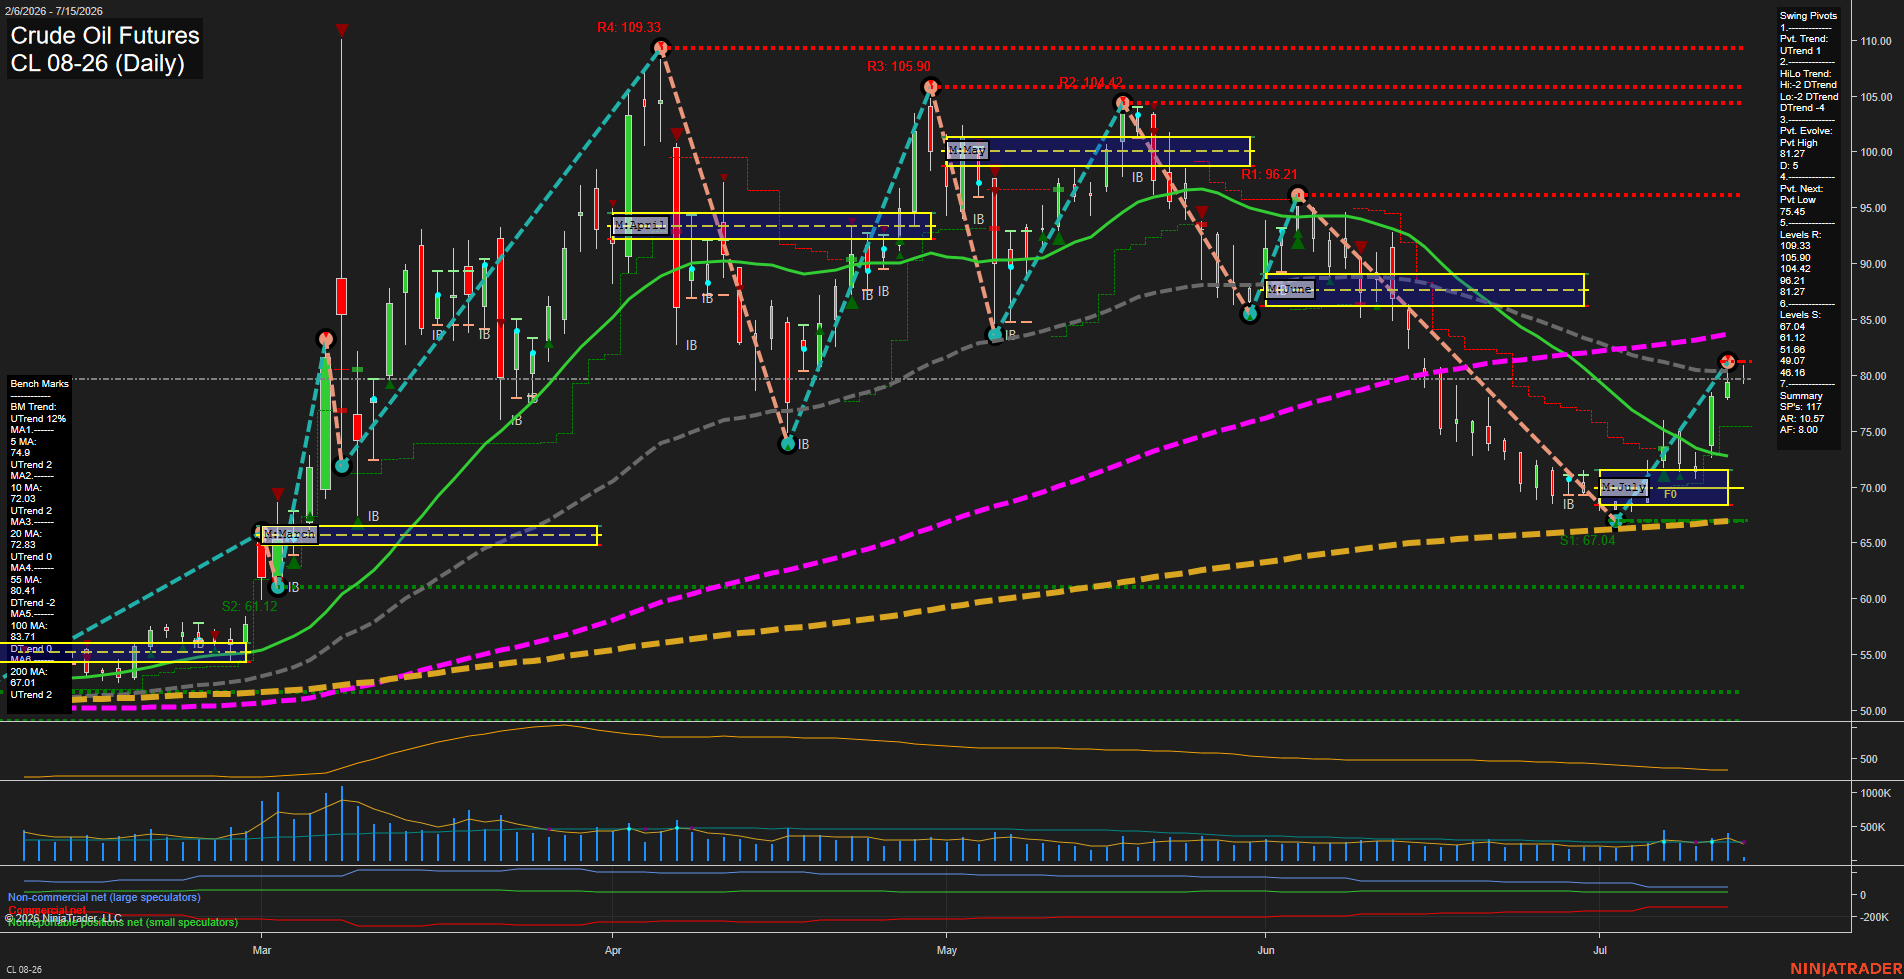
CL Crude Oil Futures Daily Chart Analysis: 2026-Jul-15 07:01 CT
Price Action
- Last: 79.04,
- Bars: Medium,
- Mom: average.
WSFG Weekly
- Short-Term
- WSFG Current: 78%
- F0%/NTZ' Bias: Price Above,
- WSFG Trend: Up.
MSFG Month Jul
- Intermediate-Term
- MSFG Current: 37%
- F0%/NTZ' Bias: Price Above,
- MSFG Trend: Up.
YSFG Year 2026
- Long-Term
- YSFG Current: 98%
- F0%/NTZ' Bias: Price Above,
- YSFG Trend: Up.
Swing Pivots
- (Short-Term) 1. Pvt. Trend: UTrend,
- (Intermediate-Term) 2. HiLo Trend: DTrend,
- 3. Pvt. Evolve: Pvt High 81.27,
- 4. Pvt. Next: Pvt Low 75.45,
- 5. Levels R: 109.33, 105.90, 104.42, 96.21, 81.27,
- 6. Levels S: 67.04, 61.12, 51.66, 49.07, 46.89.
Daily Benchmarks
- (Short-Term) 5 Day: 74.90 Up Trend,
- (Short-Term) 10 Day: 72.03 Up Trend,
- (Intermediate-Term) 20 Day: 72.38 Up Trend,
- (Intermediate-Term) 55 Day: 80.41 Down Trend,
- (Long-Term) 100 Day: 83.71 Up Trend,
- (Long-Term) 200 Day: 67.01 Up Trend.
Additional Metrics
- ATR: 10.57,
- VOLMA: 345883.
Recent Trade Signals
- 13 Jul 2026: Long CL 08-26 @ 74.5 Signals.USAR-WSFG
- 13 Jul 2026: Long CL 08-26 @ 74.69 Signals.USAR-MSFG
- 13 Jul 2026: Long CL 08-26 @ 74.39 Signals.USAR.TR120
- 08 Jul 2026: Long CL 08-26 @ 75.84 Signals.USAR.TR720
Overall Rating
- Short-Term: Bullish,
- Intermediate-Term: Bullish,
- Long-Term: Bullish.
Key Insights Summary
Crude oil remains in a constructive recovery phase after the early-July pullback, with price reclaiming the 75-area and pressing back toward the 79-80 zone. The short-term swing structure is aligned bullish, while the intermediate HiLo trend still reflects a broader downtrend backdrop, showing that the market is transitioning rather than fully escaping the prior decline. Price is above the weekly, monthly, and yearly F0%/NTZ reference zones, reinforcing a positive grid bias across all higher timeframes. The daily benchmark set is mixed but supportive overall: the 5, 10, and 20-day averages are rising, while the 55-day remains a nearby overhead pressure point. Recent long signals from WSFG, MSFG, and TR120 confirm improving momentum, and the current market profile resembles a rebound leg within a larger rotational structure.
Chart Analysis ATS AI Generated: 2026-07-15 07:01 for Informational use only, not trading advice. Terms and Risk Disclosure Copyright © 2026. Algo Trading Systems LLC.