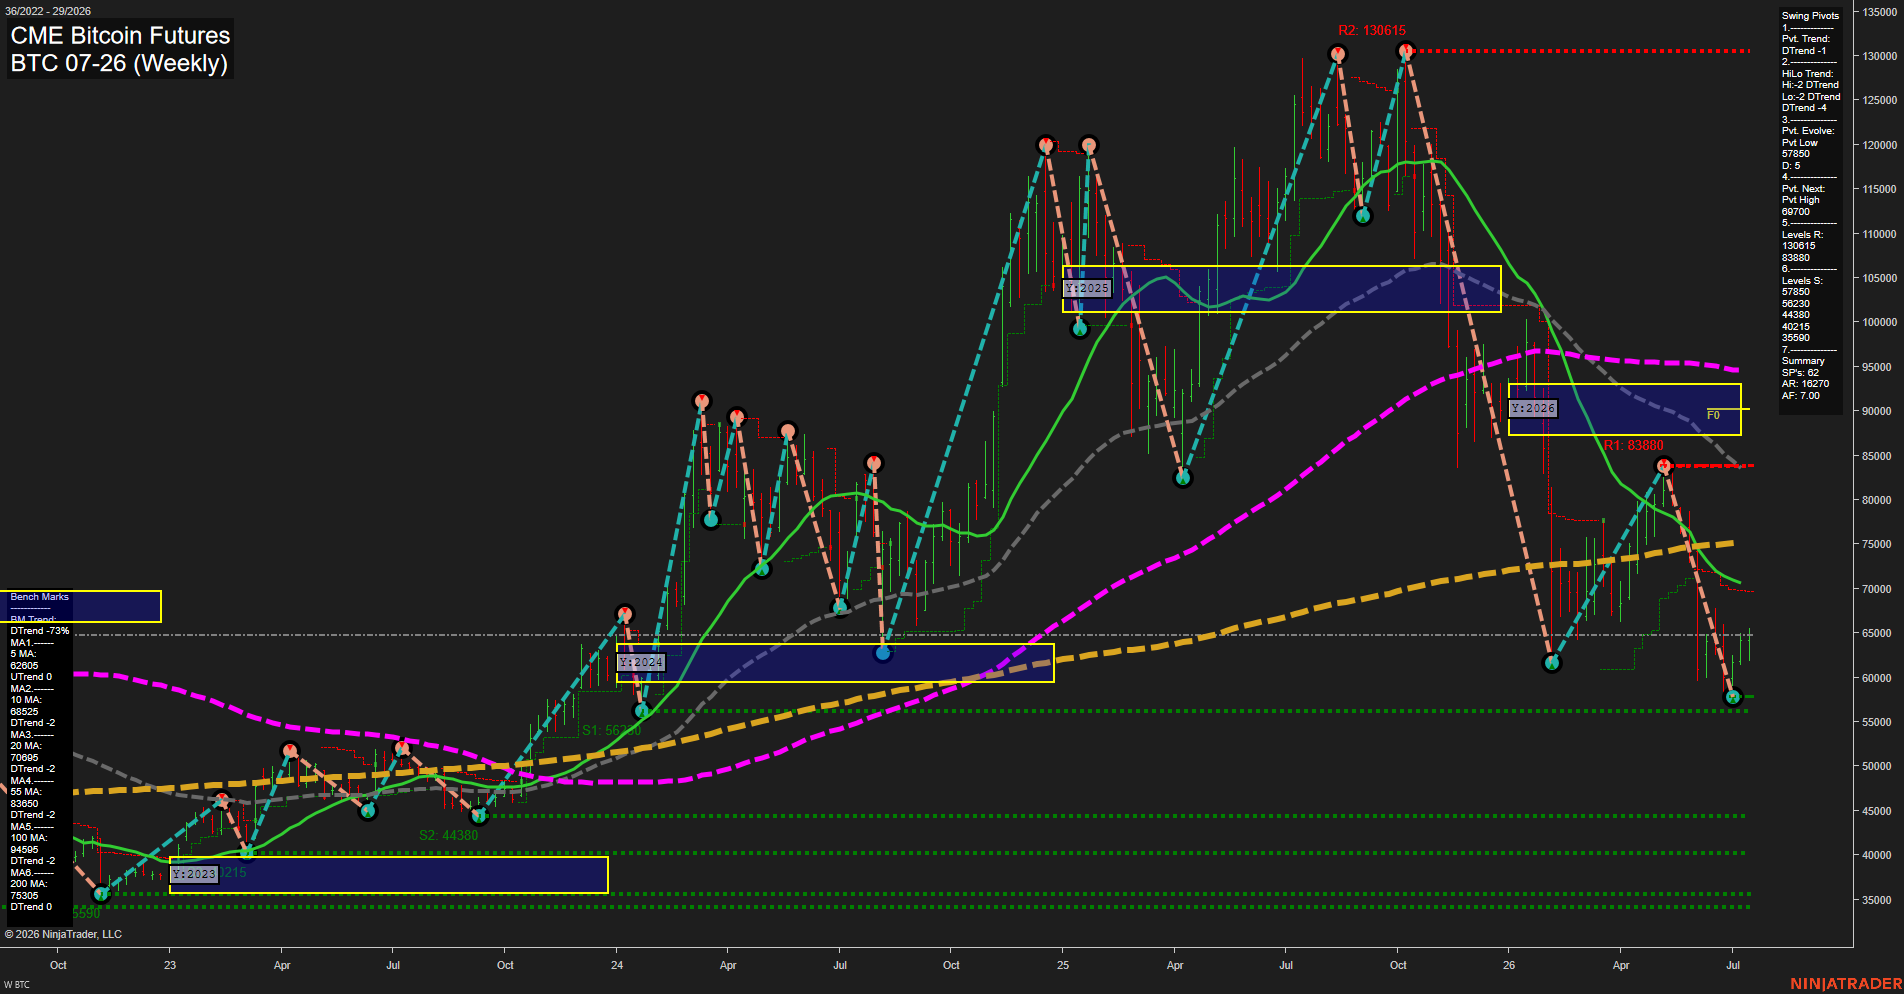
BTC CME Bitcoin Futures Weekly Chart Analysis: 2026-Jul-15 07:01 CT
Price Action
- Last: 64930,
- Bars: Medium,
- Mom: Slow.
WSFG Weekly
- Short-Term
- WSFG Current: 13%
- F0%/NTZ' Bias: Price Above,
- WSFG Trend: Up.
MSFG Month Jul
- Intermediate-Term
- MSFG Current: 43%
- F0%/NTZ' Bias: Price Above,
- MSFG Trend: Up.
YSFG Year 2026
- Long-Term
- YSFG Current: -88%
- F0%/NTZ' Bias: Price Below,
- YSFG Trend: Down.
Swing Pivots
- (Short-Term) 1. Pvt. Trend: DTrend,
- (Intermediate-Term) 2. HiLo Trend: DTrend,
- 3. Pvt. Evolve: Pvt low 57850,
- 4. Pvt. Next: Pvt High 69700,
- 5. Levels R: 130615, 83880,
- 6. Levels S: 57850, 56230, 44380, 40215, 35590.
Weekly Benchmarks
- (Short-Term) 5 Day: 62605 Down Trend,
- (Short-Term) 10 Day: 68525 Down Trend,
- (Intermediate-Term) 20 Day: 70695 Down Trend,
- (Intermediate-Term) 55 Day: 83650 Down Trend,
- (Long-Term) 100 Day: 94595 Down Trend,
- (Long-Term) 200 Day: 75305 Down Trend.
Recent Trade Signals
- 15 Jul 2026: Long BTC 07-26 @ 64930 Signals.USAR-WSFG
- 14 Jul 2026: Long BTC 07-26 @ 64945 Signals.USAR.TR120
- 07 Jul 2026: Long BTC 07-26 @ 64110 Signals.USAR.TR720
Overall Rating
- Short-Term: Neutral,
- Intermediate-Term: Neutral,
- Long-Term: Bearish.
Key Insights Summary
BTC CME weekly structure is trading in a sharp corrective phase after a major peak near 130615, with price now back near the 58k to 70k support band and sitting below the key 55, 100, and 20 week benchmarks. Short-term session fib conditions remain constructive with WSFG and MSFG both above F0%, and the recent long signals reflect a rebound attempt off the 57850 pivot low, but the pivot trend and HiLo trend are still in DTrend mode, showing that the larger swing structure has not fully reversed. The weekly candles are coming off a steep downside leg, so momentum is still slow and the market is working through a test-and-reaction phase around lower support rather than a confirmed trend breakout. Long-term context stays bearish because YSFG is deep below F0% and the 100-day and 55-day benchmarks remain overhead, while the current chart shows a recovery attempt inside a broader down cycle with lower highs and lower lows dominating the recent swing sequence.
Chart Analysis ATS AI Generated: 2026-07-15 07:01 for Informational use only, not trading advice. Terms and Risk Disclosure Copyright © 2026. Algo Trading Systems LLC.