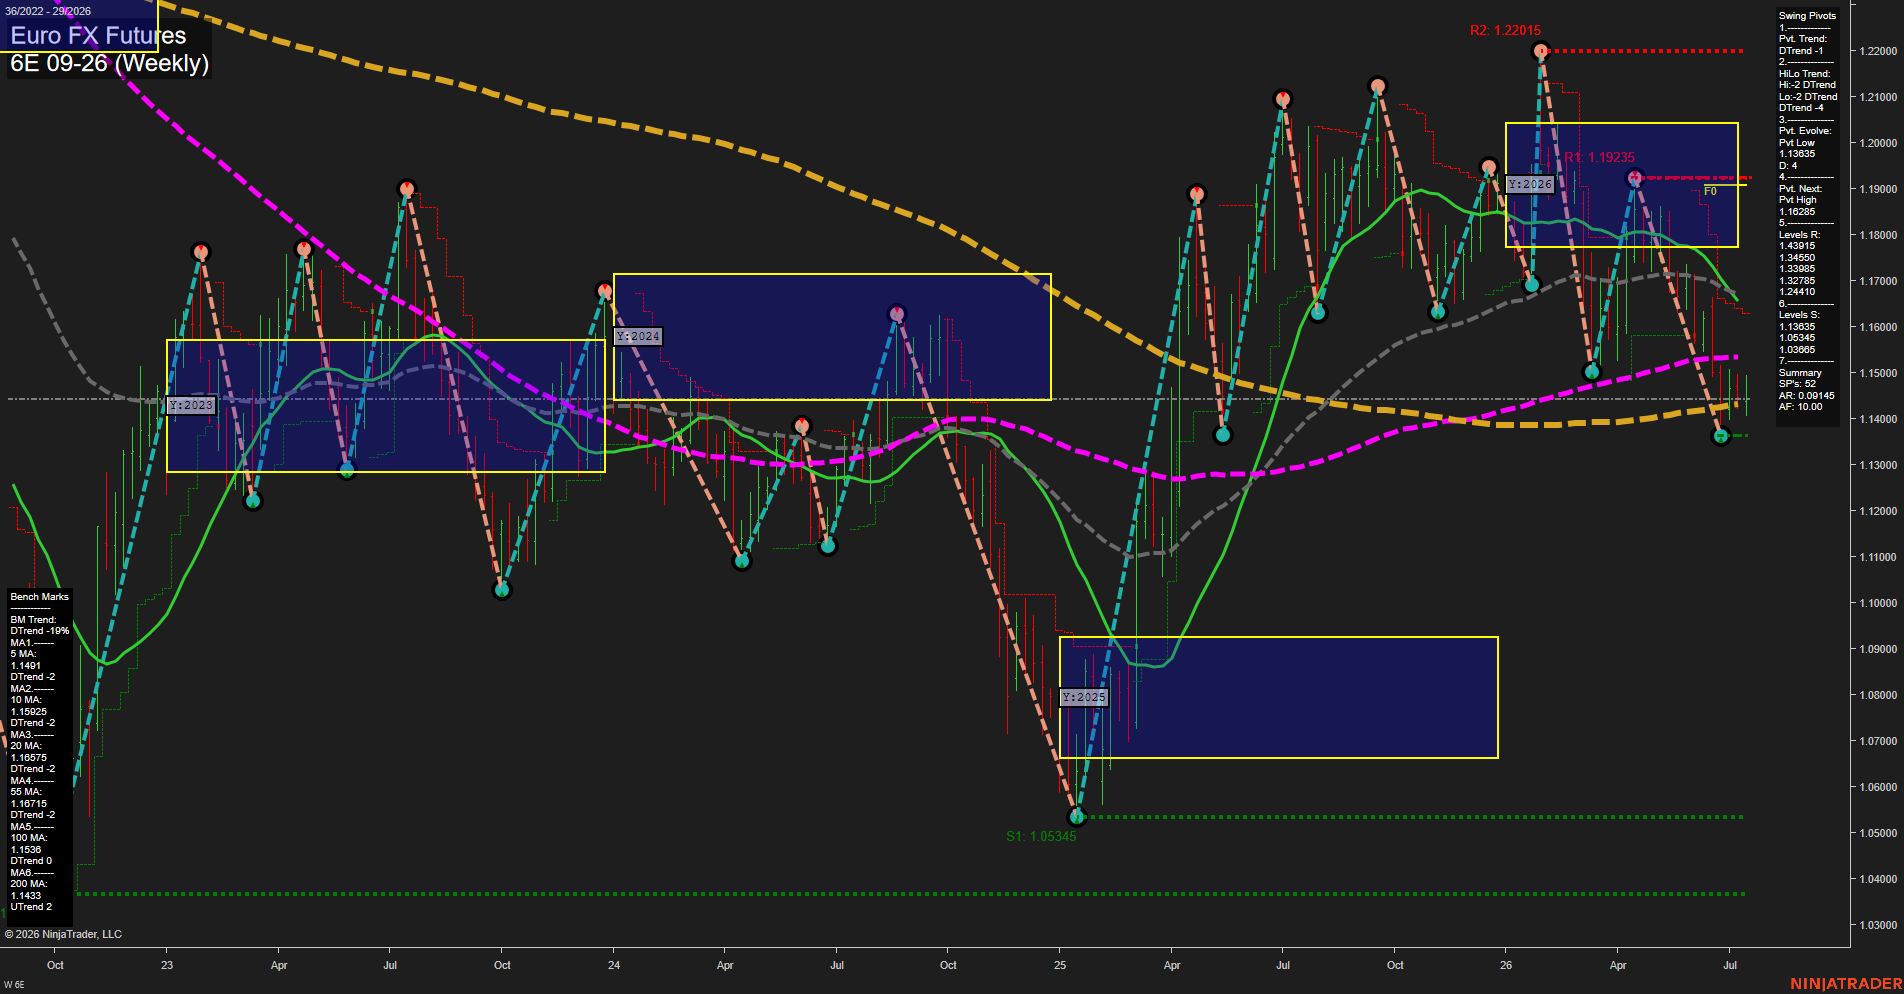
6E Euro FX Futures Weekly Chart Analysis: 2026-Jul-15 07:00 CT
Price Action
- Last: 1.1450,
- Bars: Large,
- Mom: fast.
WSFG Weekly
- Short-Term
- WSFG Current: 3%
- F0%/NTZ' Bias: Price Above,
- WSFG Trend: Up.
MSFG Month Jul
- Intermediate-Term
- MSFG Current: 0%
- F0%/NTZ' Bias: Price Neutral,
- MSFG Trend: Neutral.
YSFG Year 2026
- Long-Term
- YSFG Current: -35%
- F0%/NTZ' Bias: Price Below,
- YSFG Trend: Down.
Swing Pivots
- (Short-Term) 1. Pvt. Trend: DTrend,
- (Intermediate-Term) 2. HiLo Trend: DTrend,
- 3. Pvt. Evolve: Pvt Low 1.13635,
- 4. Pvt. Next: Pvt High 1.16285,
- 5. Levels R: 1.43915, 1.34500, 1.33985, 1.32785, 1.24410,
- 6. Levels S: 1.13635, 1.05345, 1.03865.
Weekly Benchmarks
- (Short-Term) 5 Day: 1.1491 Down Trend,
- (Short-Term) 10 Day: 1.15925 Down Trend,
- (Intermediate-Term) 20 Day: 1.16575 Down Trend,
- (Intermediate-Term) 55 Day: 1.16715 Down Trend,
- (Long-Term) 100 Day: 1.1536 Down Trend,
- (Long-Term) 200 Day: 1.1433 Up Trend.
Recent Trade Signals
- 15 Jul 2026: Long 6E 09-26 @ 1.1469 Signals.USAR-MSFG
- 14 Jul 2026: Long 6E 09-26 @ 1.1452 Signals.USAR-WSFG
- 14 Jul 2026: Long 6E 09-26 @ 1.14565 Signals.USAR.TR120
Overall Rating
- Short-Term: Bullish,
- Intermediate-Term: Neutral,
- Long-Term: Bearish.
Key Insights Summary
Price is trading near 1.1450 after a strong weekly rebound from the 2025 low area, with fast upside momentum carrying it back toward the 1.15 handle. The weekly session grid is positive and sitting above the F0% line, which matches the recent long signals on the short-term timing models. The monthly grid is flat at neutral, showing that the rebound has not yet fully converted into a sustained intermediate trend. The yearly grid remains negative and below F0%, keeping the broader 2026 structure in a downtrend even as price stabilizes above the 2025 lows. Swing pivot structure still reads DTrend on both the short-term and hi/lo trend metrics, while benchmark moving averages remain mostly overhead and bearish, with only the 200-day benchmark still in an up trend. This leaves the chart in a transition phase where the weekly recovery is strong, but the larger-cycle backdrop is still working through a broader downtrend and prior resistance bands.
Chart Analysis ATS AI Generated: 2026-07-15 07:01 for Informational use only, not trading advice. Terms and Risk Disclosure Copyright © 2026. Algo Trading Systems LLC.