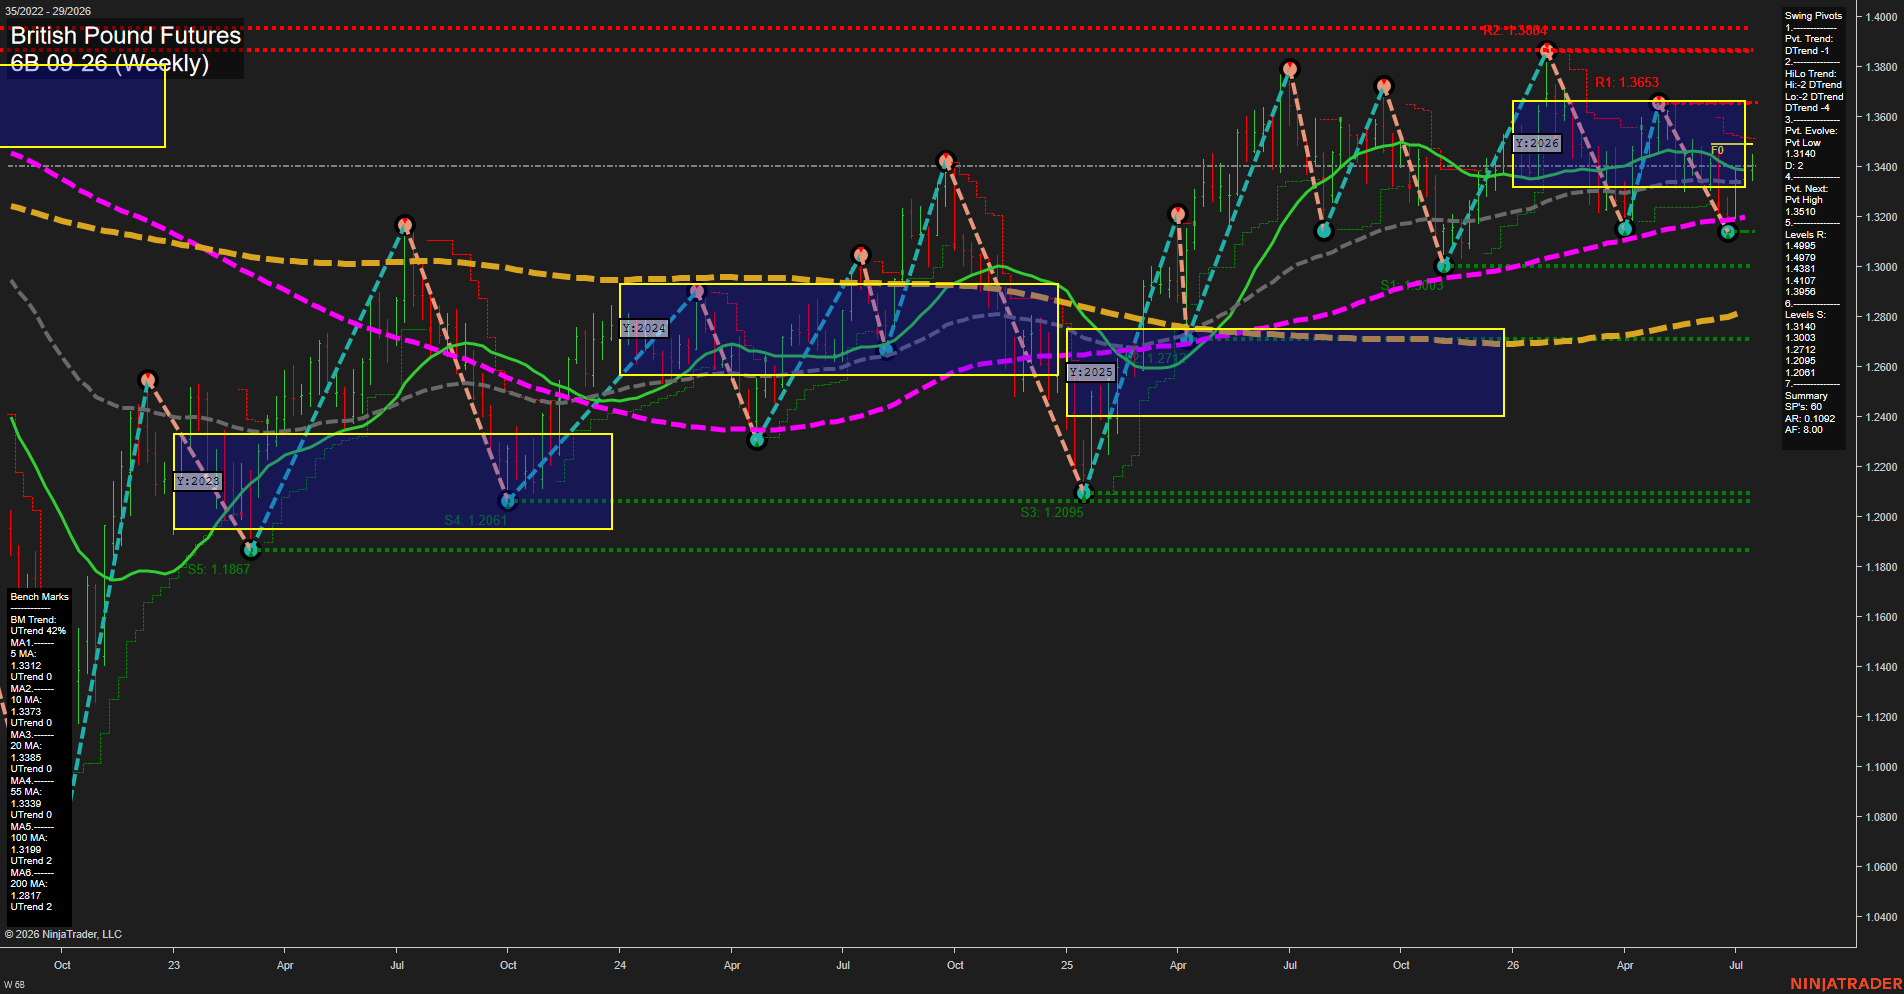
6B British Pound Futures Weekly Chart Analysis: 2026-Jul-15 07:00 CT
Price Action
- Last: 1.3140,
- Bars: Medium,
- Mom: average.
WSFG Weekly
- Short-Term
- WSFG Current: 14%
- F0%/NTZ' Bias: Price Above,
- WSFG Trend: Up.
MSFG Month Jul
- Intermediate-Term
- MSFG Current: 48%
- F0%/NTZ' Bias: Price Above,
- MSFG Trend: Up.
YSFG Year 2026
- Long-Term
- YSFG Current: -5%
- F0%/NTZ' Bias: Price Below,
- YSFG Trend: Down.
Swing Pivots
- (Short-Term) 1. Pvt. Trend: DTrend,
- (Intermediate-Term) 2. HiLo Trend: DTrend,
- 3. Pvt. Evolve: Pvt Low 1.3140,
- 4. Pvt. Next: Pvt High 1.3510,
- 5. Levels R: 1.4995, 1.4799, 1.4381, 1.4107, 1.3958,
- 6. Levels S: 1.3140, 1.3003, 1.2712, 1.2095, 1.1867.
Weekly Benchmarks
- (Short-Term) 5 Day: 1.3312 Down Trend,
- (Short-Term) 10 Day: 1.3373 Down Trend,
- (Intermediate-Term) 20 Day: 1.3385 Down Trend,
- (Intermediate-Term) 55 Day: 1.3339 Down Trend,
- (Long-Term) 100 Day: 1.3199 Up Trend,
- (Long-Term) 200 Day: 1.2817 Up Trend.
Recent Trade Signals
- 15 Jul 2026: Long 6B 09-26 @ 1.3409 Signals.USAR-WSFG
- 08 Jul 2026: Long 6B 09-26 @ 1.3401 Signals.USAR.TR120
Overall Rating
- Short-Term: Neutral,
- Intermediate-Term: Neutral,
- Long-Term: Neutral.
Key Insights Summary
Weekly price is holding near 1.3140, sitting below the 5, 10, 20, and 55 week benchmarks while still above the 100 and 200 week averages, which leaves the structure mixed rather than trending cleanly. The short-term pivot sequence remains in DTrend, with the current evolve point marked as a pivot low and the next pivot projection pointing to a pivot high at 1.3510, reflecting an active recovery attempt after the prior selloff. WSFG and monthly fib structure are both above their F0%/NTZ midlines and point upward, but the yearly grid remains below its midline and still carries a down bias, showing that the larger 2026 backdrop is not fully repaired. The chart is transitioning from a volatile reset phase into a range-to-recovery phase, with repeated tests around the 1.30 to 1.32 area and overhead supply layered through 1.33 to 1.35, while higher resistance remains stacked into the 1.39 to 1.49 zone.
Chart Analysis ATS AI Generated: 2026-07-15 07:00 for Informational use only, not trading advice. Terms and Risk Disclosure Copyright © 2026. Algo Trading Systems LLC.