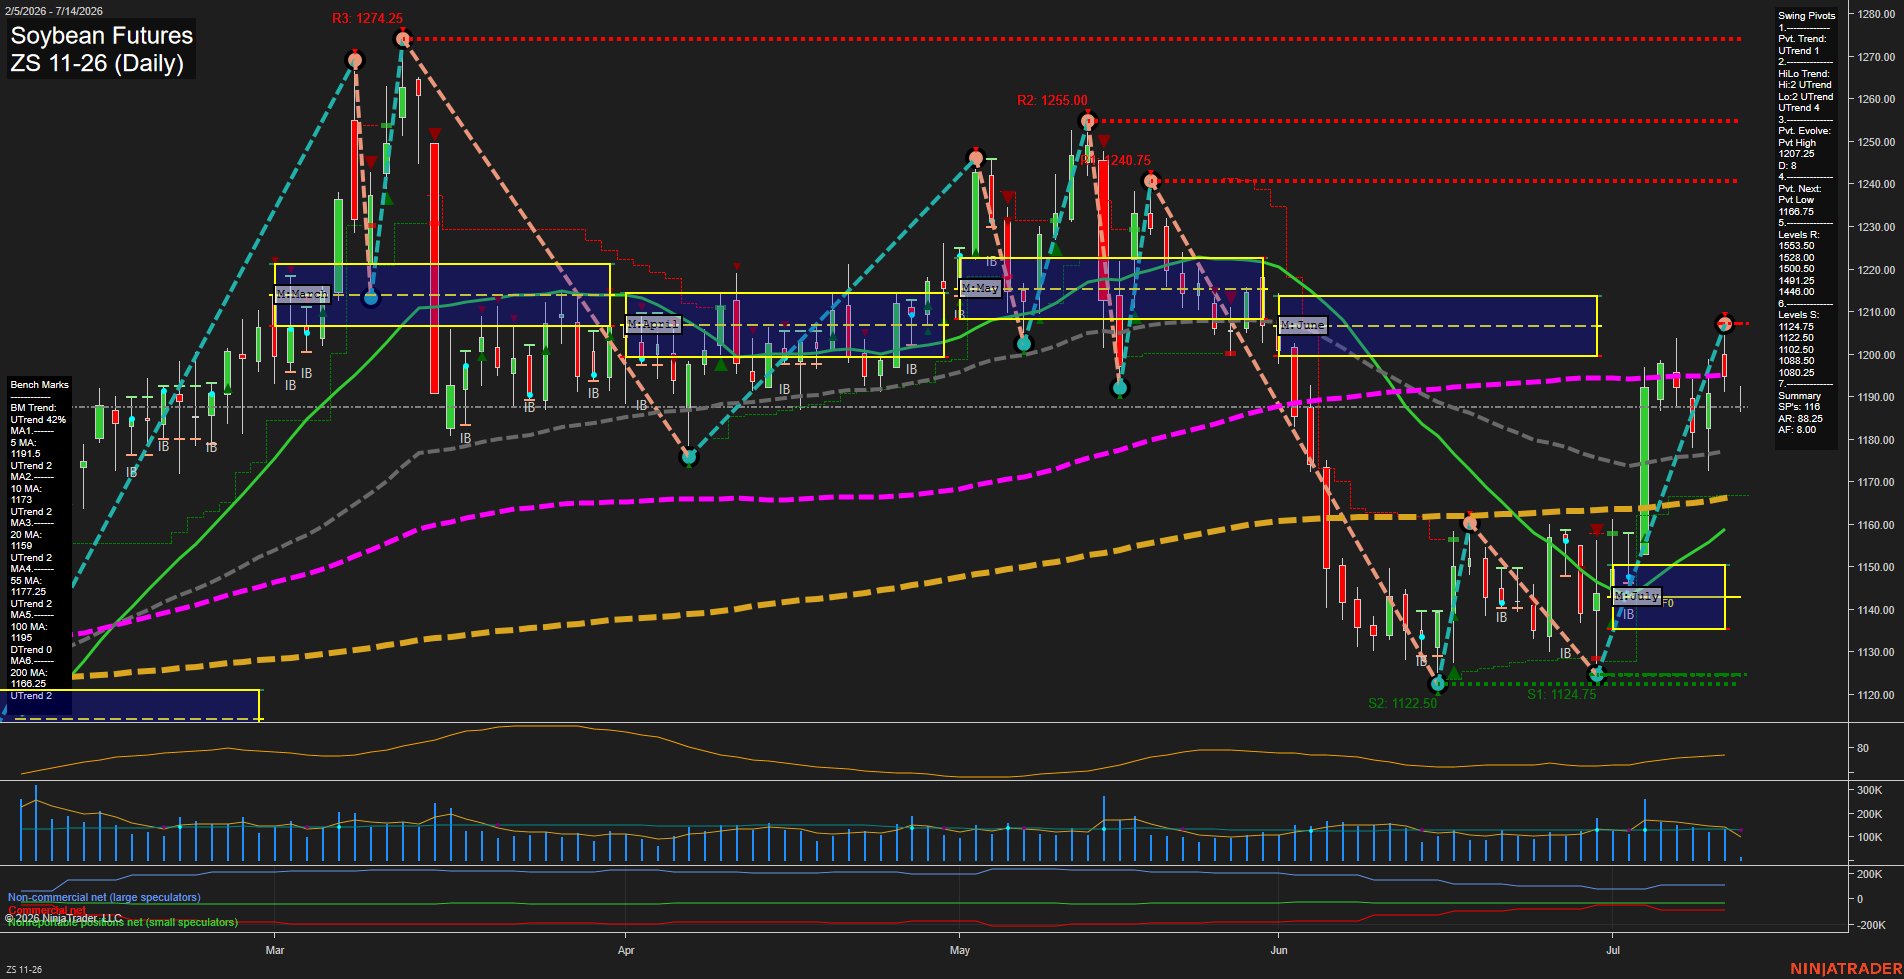
ZS Soybean Futures Daily Chart Analysis: 2026-Jul-14 07:08 CT
Price Action
- Last: 1196.5,
- Bars: Medium,
- Mom: average.
WSFG Weekly
- Short-Term
- WSFG Current: -36%
- F0%/NTZ' Bias: Price Below,
- WSFG Trend: Down.
MSFG Month Jul
- Intermediate-Term
- MSFG Current: 56%
- F0%/NTZ' Bias: Price Above,
- MSFG Trend: Up.
YSFG Year 2026
- Long-Term
- YSFG Current: 20%
- F0%/NTZ' Bias: Price Above,
- YSFG Trend: Up.
Swing Pivots
- (Short-Term) 1. Pvt. Trend: UTrend,
- (Intermediate-Term) 2. HiLo Trend: UTrend,
- 3. Pvt. Evolve: Pvt High 1207.25,
- 4. Pvt. Next: Pvt Low 1168.75,
- 5. Levels R: 1553.50, 1528.00, 1500.50, 1491.25, 1446.00,
- 6. Levels S: 1124.75, 1122.50, 1102.50, 1088.50, 1070.25.
Daily Benchmarks
- (Short-Term) 5 Day: 1191.5 Up Trend,
- (Short-Term) 10 Day: 1173 Up Trend,
- (Intermediate-Term) 20 Day: 1159 Up Trend,
- (Intermediate-Term) 55 Day: 1177.25 Up Trend,
- (Long-Term) 100 Day: 1195 Down Trend,
- (Long-Term) 200 Day: 1166.25 Up Trend.
Additional Metrics
Recent Trade Signals
- 13 Jul 2026: Long ZS 11-26 @ 1196.5 Signals.USAR.TR120
Overall Rating
- Short-Term: Bullish,
- Intermediate-Term: Bullish,
- Long-Term: Neutral.
Key Insights Summary
Soybean futures are trading near the upper end of the recent July recovery after the June selloff and subsequent rebound, with price back above the 20, 55, and 200-day benchmarks while still sitting near the 100-day reference. Short-term structure is constructive as the pivot trend remains UTrend and the latest swing sequence shows higher lows from the June base. Intermediate-term tone is also positive because the monthly session fib bias is above F0% and the July MSFG trend is up, aligning with the rebound from the lower-June support zone. The long-term picture is mixed but stabilizing: the yearly fib bias remains above F0%, while the 100-day benchmark still reads down, leaving the broader trend less uniform than the shorter horizons. Recent price action shows a V-shaped recovery from the 1120s region into the 1190s, with resistance being tested near the prior pivot high area around 1207.25 and support clustered around 1168.75 to 1124.75.
Chart Analysis ATS AI Generated: 2026-07-14 07:09 for Informational use only, not trading advice. Terms and Risk Disclosure Copyright © 2026. Algo Trading Systems LLC.