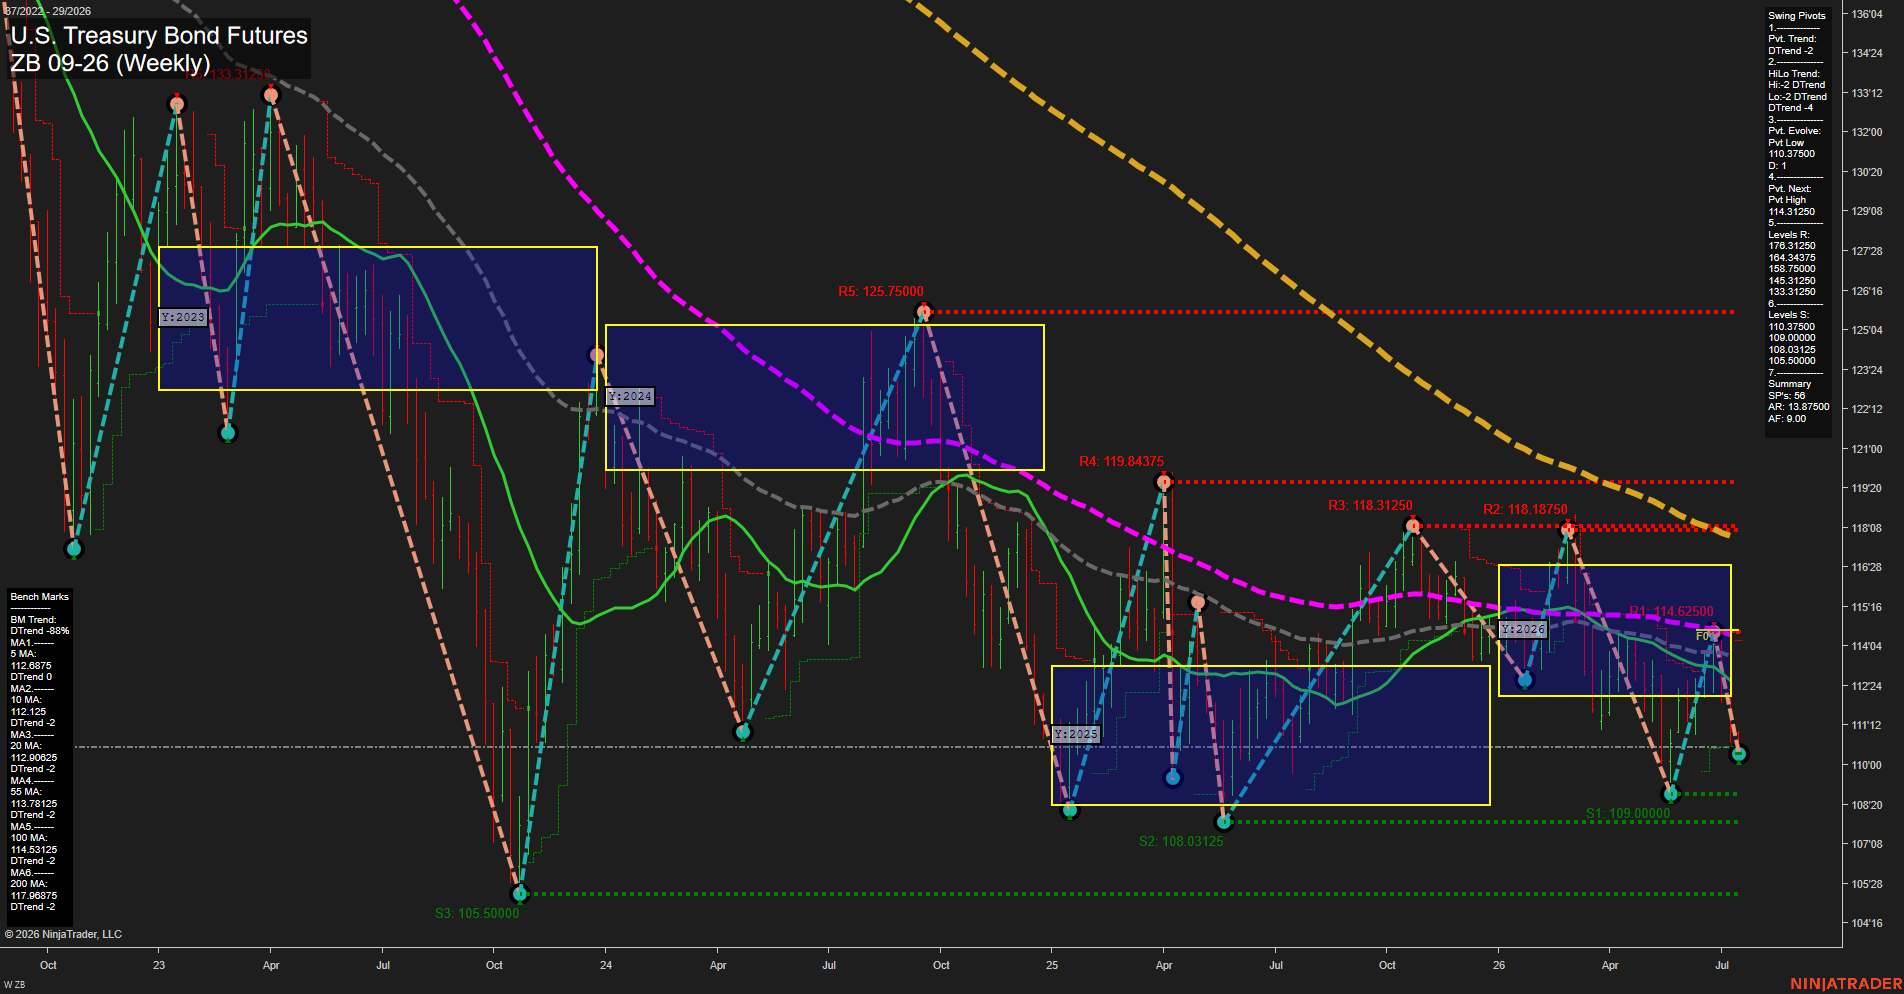
ZB U.S. Treasury Bond Futures Weekly Chart Analysis: 2026-Jul-14 07:08 CT
Price Action
- Last: 114.6250,
- Bars: Medium,
- Mom: slow.
WSFG Weekly
- Short-Term
- WSFG Current: NA%
- F0%/NTZ' Bias: Price Neutral,
- WSFG Trend: Neutral.
MSFG Month Jul
- Intermediate-Term
- MSFG Current: NA%
- F0%/NTZ' Bias: Price Neutral,
- MSFG Trend: Neutral.
YSFG Year 2026
- Long-Term
- YSFG Current: NA%
- F0%/NTZ' Bias: Price Neutral,
- YSFG Trend: Neutral.
Swing Pivots
- (Short-Term) 1. Pvt. Trend: DTrend,
- (Intermediate-Term) 2. HiLo Trend: DTrend,
- 3. Pvt. Evolve: Pvt Low 110.3750,
- 4. Pvt. Next: Pvt High 114.3125,
- 5. Levels R: 176.3125, 164.34375, 158.7500, 145.3125, 133.3125,
- 6. Levels S: 110.3750, 109.0000, 108.03125, 105.5000.
Weekly Benchmarks
- (Short-Term) 5 Day: 112.6875 Down Trend,
- (Short-Term) 10 Day: 112.1250 Down Trend,
- (Intermediate-Term) 20 Day: 112.90625 Down Trend,
- (Intermediate-Term) 55 Day: 113.78125 Down Trend,
- (Long-Term) 100 Day: 114.53125 Down Trend,
- (Long-Term) 200 Day: 117.96875 Down Trend.
Overall Rating
- Short-Term: Bearish,
- Intermediate-Term: Bearish,
- Long-Term: Bearish.
Key Insights Summary
ZB is trading in a weak weekly structure with price sitting near the 2026 NTZ / F0% zone at 114.6250 after a decline from the spring swing highs. The pivot framework remains in DTrend on both the short-term and intermediate-term measures, and the benchmark moving averages are aligned in a downward stack, reinforcing a soft trend profile. Price is holding well above the nearest swing supports at 110.3750, 109.0000, 108.03125, and 105.5000, while overhead resistance is layered at 118.7500, 119.84375, and 125.7500 from prior pivot highs. The larger picture remains range-to-downtrend behavior with repeated rejection from higher resistance bands and only partial recovery from the latest low, leaving the weekly action in a corrective bounce within a broader bearish tape.
Chart Analysis ATS AI Generated: 2026-07-14 07:08 for Informational use only, not trading advice. Terms and Risk Disclosure Copyright © 2026. Algo Trading Systems LLC.