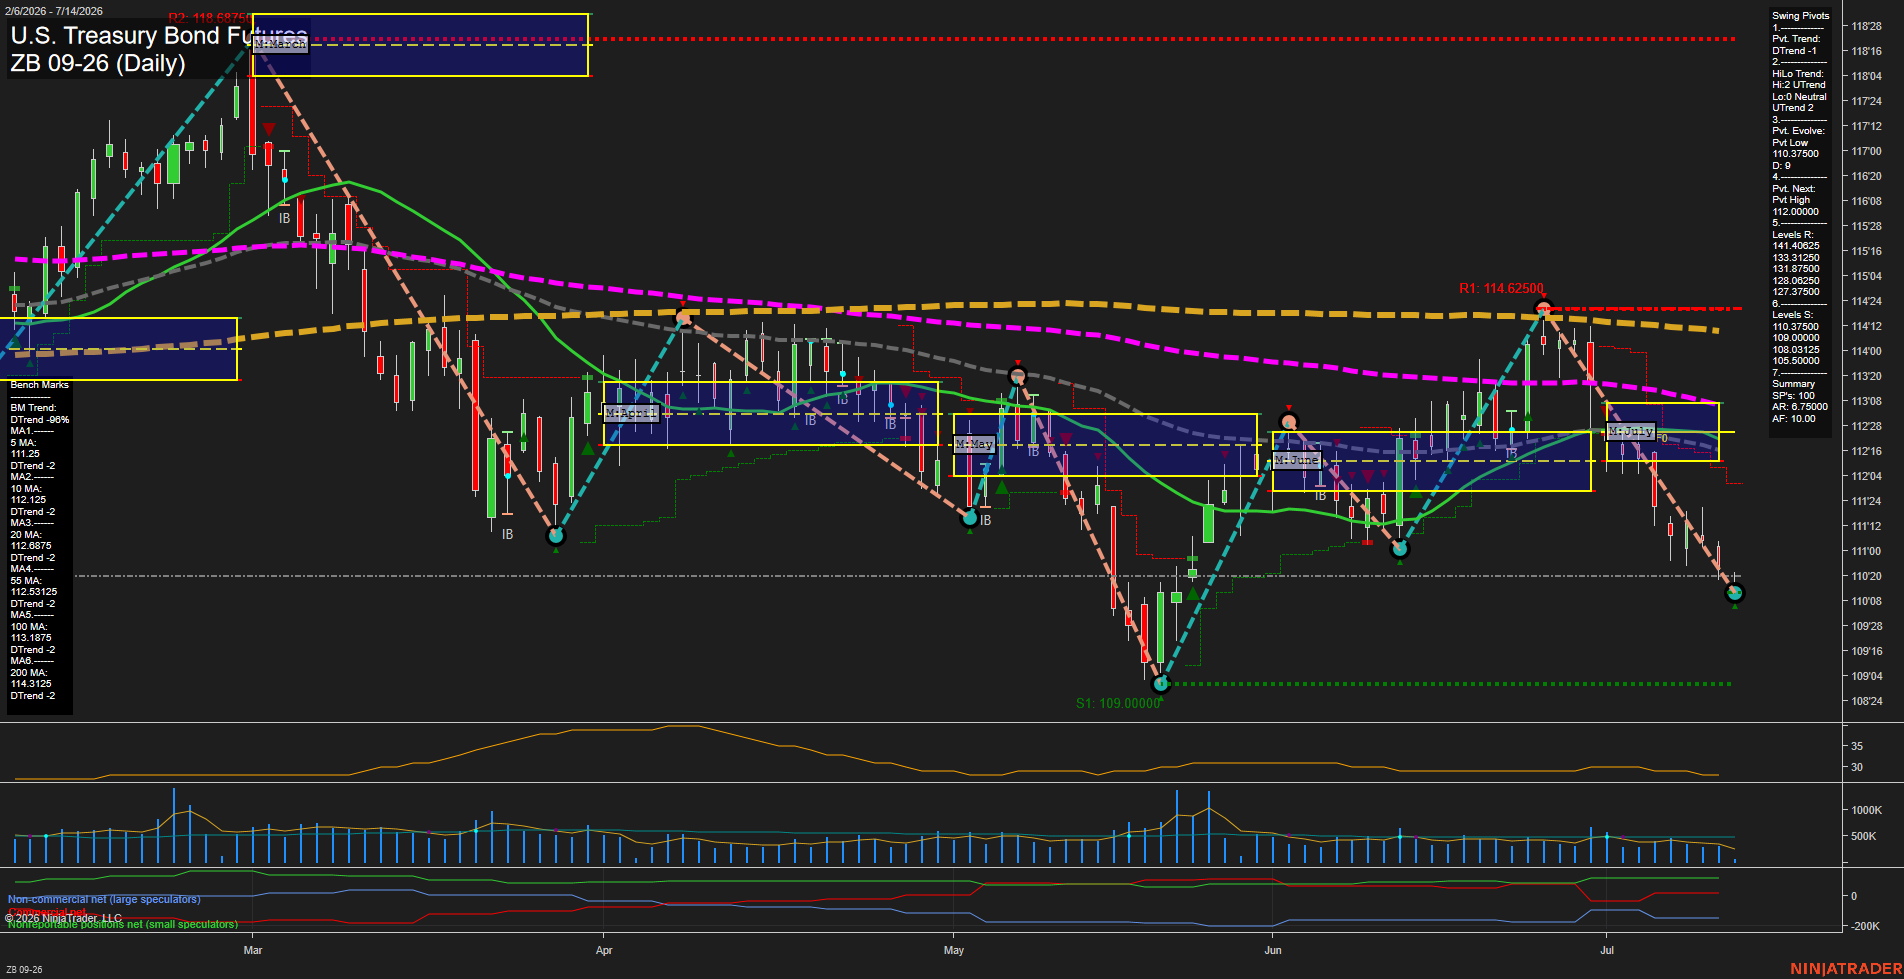
ZB U.S. Treasury Bond Futures Daily Chart Analysis: 2026-Jul-14 07:08 CT
Price Action
- Last: 110.08,
- Bars: Medium,
- Mom: slow.
WSFG Weekly
- Short-Term
- WSFG Current: NA%
- F0%/NTZ' Bias: Price Neutral,
- WSFG Trend: Neutral.
MSFG Month Jul
- Intermediate-Term
- MSFG Current: NA%
- F0%/NTZ' Bias: Price Neutral,
- MSFG Trend: Neutral.
YSFG Year 2026
- Long-Term
- YSFG Current: NA%
- F0%/NTZ' Bias: Price Neutral,
- YSFG Trend: Neutral.
Swing Pivots
- (Short-Term) 1. Pvt. Trend: DTrend,
- (Intermediate-Term) 2. HiLo Trend: UTrend,
- 3. Pvt. Evolve: Pvt Low 110.37500,
- 4. Pvt. Next: Pvt High 112.00000,
- 5. Levels R: 141.40625, 133.31250, 131.87500, 128.06250, 127.37500,
- 6. Levels S: 110.37500, 109.00000, 108.03125, 105.50000.
Daily Benchmarks
- (Short-Term) 5 Day: 111.25 Down Trend,
- (Short-Term) 10 Day: 112.125 Down Trend,
- (Intermediate-Term) 20 Day: 112.6875 Down Trend,
- (Intermediate-Term) 55 Day: 112.53125 Down Trend,
- (Long-Term) 100 Day: 113.1875 Down Trend,
- (Long-Term) 200 Day: 114.3125 Down Trend.
Additional Metrics
Overall Rating
- Short-Term: Bearish,
- Intermediate-Term: Bearish,
- Long-Term: Bearish.
Key Insights Summary
The daily structure remains defined by a persistent downside swing cycle with price trading well below the benchmark moving averages and below the major monthly and yearly pivot reference zones. The failed July rebound stalled under the 114.6250 resistance area, and the subsequent rejection produced a clear lower-high sequence that keeps the dominant swing pressure pointed lower. The pivot map still reflects a bearish short-term trend, while the broader benchmark stack stays aligned in a downward slope, reinforcing a weak intermediate and long-term backdrop. Volatility is orderly rather than explosive, with the ATR steady and volume moderate, which fits a grinding trend day-to-day decline instead of a sharp capitulation move.
Chart Analysis ATS AI Generated: 2026-07-14 07:08 for Informational use only, not trading advice. Terms and Risk Disclosure Copyright © 2026. Algo Trading Systems LLC.