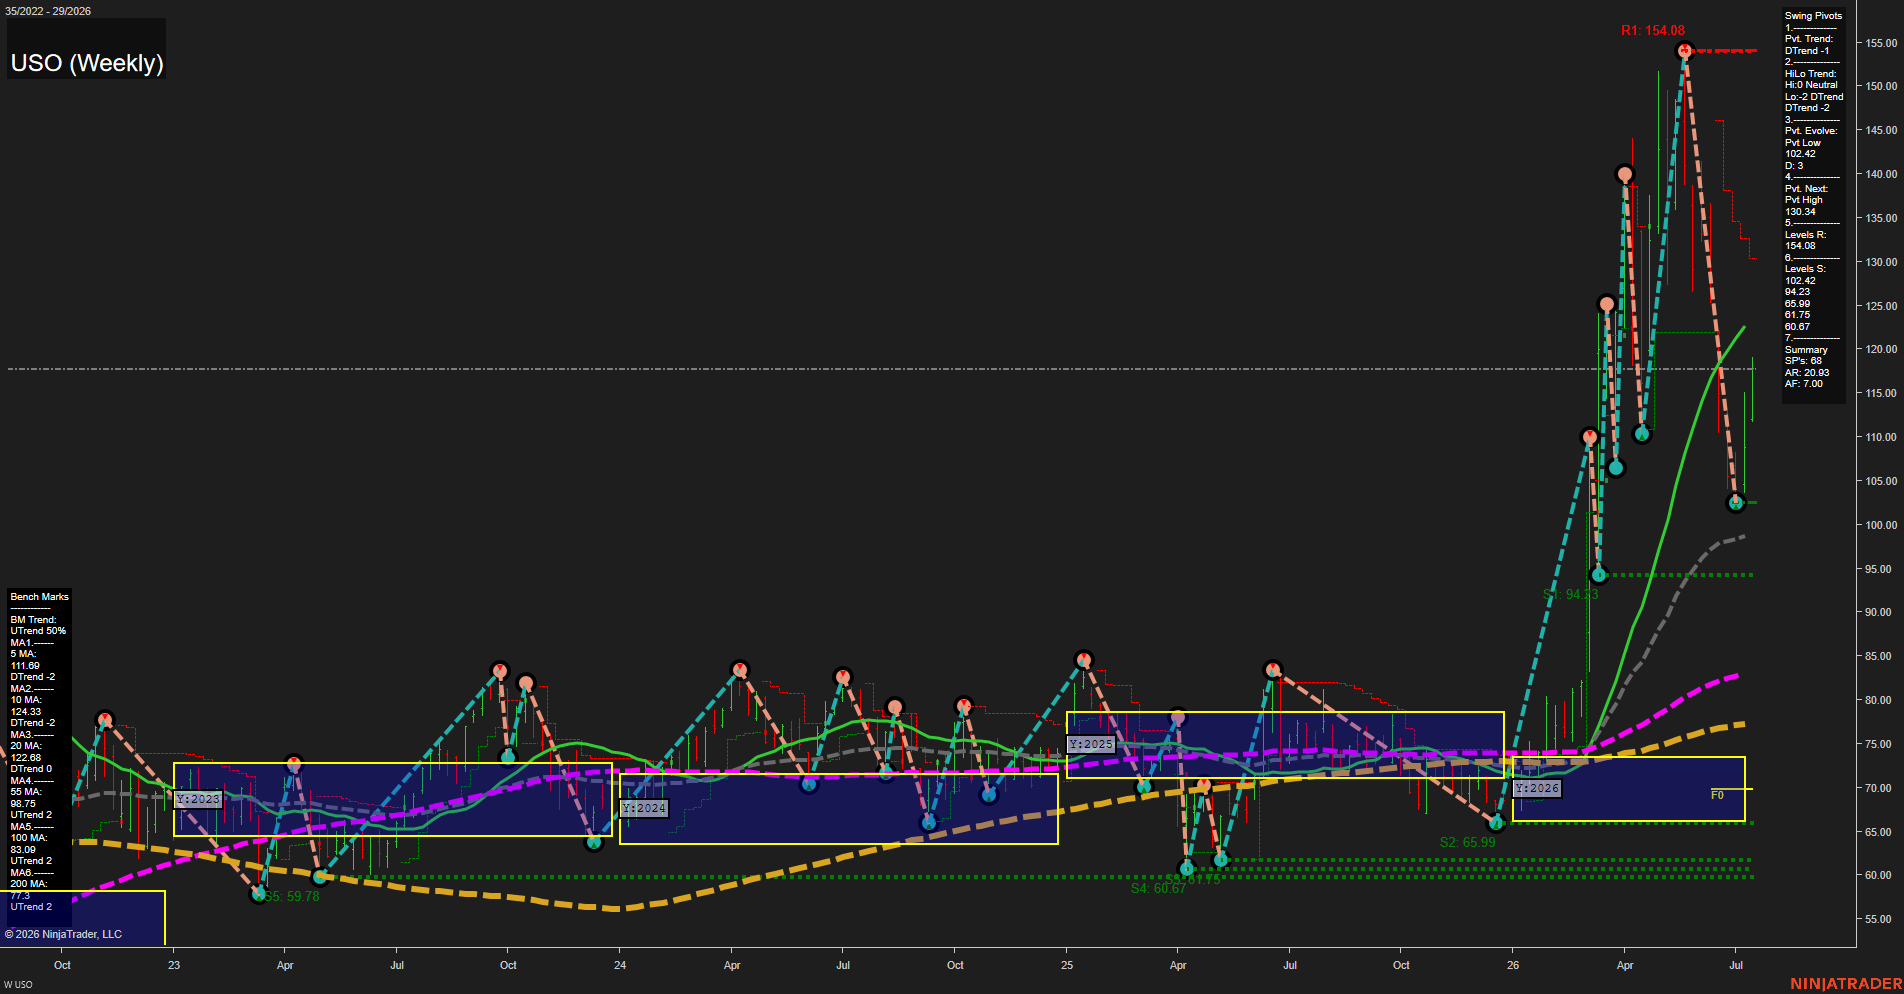
USO United States Oil Fund LP Weekly Chart Analysis: 2026-Jul-14 07:07 CT
Price Action
- Last: 103.00,
- Bars: Large,
- Mom: fast.
WSFG Weekly
- Short-Term
- WSFG Current: NA%
- F0%/NTZ' Bias: Price Neutral,
- WSFG Trend: Neutral.
MSFG Month Jul
- Intermediate-Term
- MSFG Current: NA%
- F0%/NTZ' Bias: Price Neutral,
- MSFG Trend: Neutral.
YSFG Year 2026
- Long-Term
- YSFG Current: NA%
- F0%/NTZ' Bias: Price Neutral,
- YSFG Trend: Neutral.
Swing Pivots
- (Short-Term) 1. Pvt. Trend: DTrend,
- (Intermediate-Term) 2. HiLo Trend: DTrend,
- 3. Pvt. Evolve: Pvt Low 102.42,
- 4. Pvt. Next: Pvt High 130.34,
- 5. Levels R: 154.08,
- 6. Levels S: 102.42, 94.23, 65.99, 61.75, 60.67.
Weekly Benchmarks
- (Short-Term) 5 Day: 111.69 Down Trend,
- (Short-Term) 10 Day: 124.33 Down Trend,
- (Intermediate-Term) 20 Day: 122.68 Down Trend,
- (Intermediate-Term) 55 Day: 98.75 Up Trend,
- (Long-Term) 100 Day: 83.09 Up Trend,
- (Long-Term) 200 Day: 77.30 Up Trend.
Overall Rating
- Short-Term: Bearish,
- Intermediate-Term: Neutral,
- Long-Term: Bullish.
Key Insights Summary
USO is in a sharp weekly pullback after a powerful multi-week rally into the 150s, leaving price well below the short-term benchmarks while still holding above the rising 55, 100, and 200-week benchmarks. The short-term pivot structure is in DTrend with the latest evolve point at the 102.42 low, which now acts as the key nearby reference, while the next opposing pivot remains the 130.34 high. The weekly and monthly session fib structures are neutral, showing the market has moved back into a mean-reversion zone after an extended expansion. From a futures swing trader’s viewpoint, the tape has shifted from acceleration to retracement, with near-term momentum still heavy, but the broader trend structure remaining constructive as long as the major longer-term benchmarks continue to slope higher.
Chart Analysis ATS AI Generated: 2026-07-14 07:07 for Informational use only, not trading advice. Terms and Risk Disclosure Copyright © 2026. Algo Trading Systems LLC.