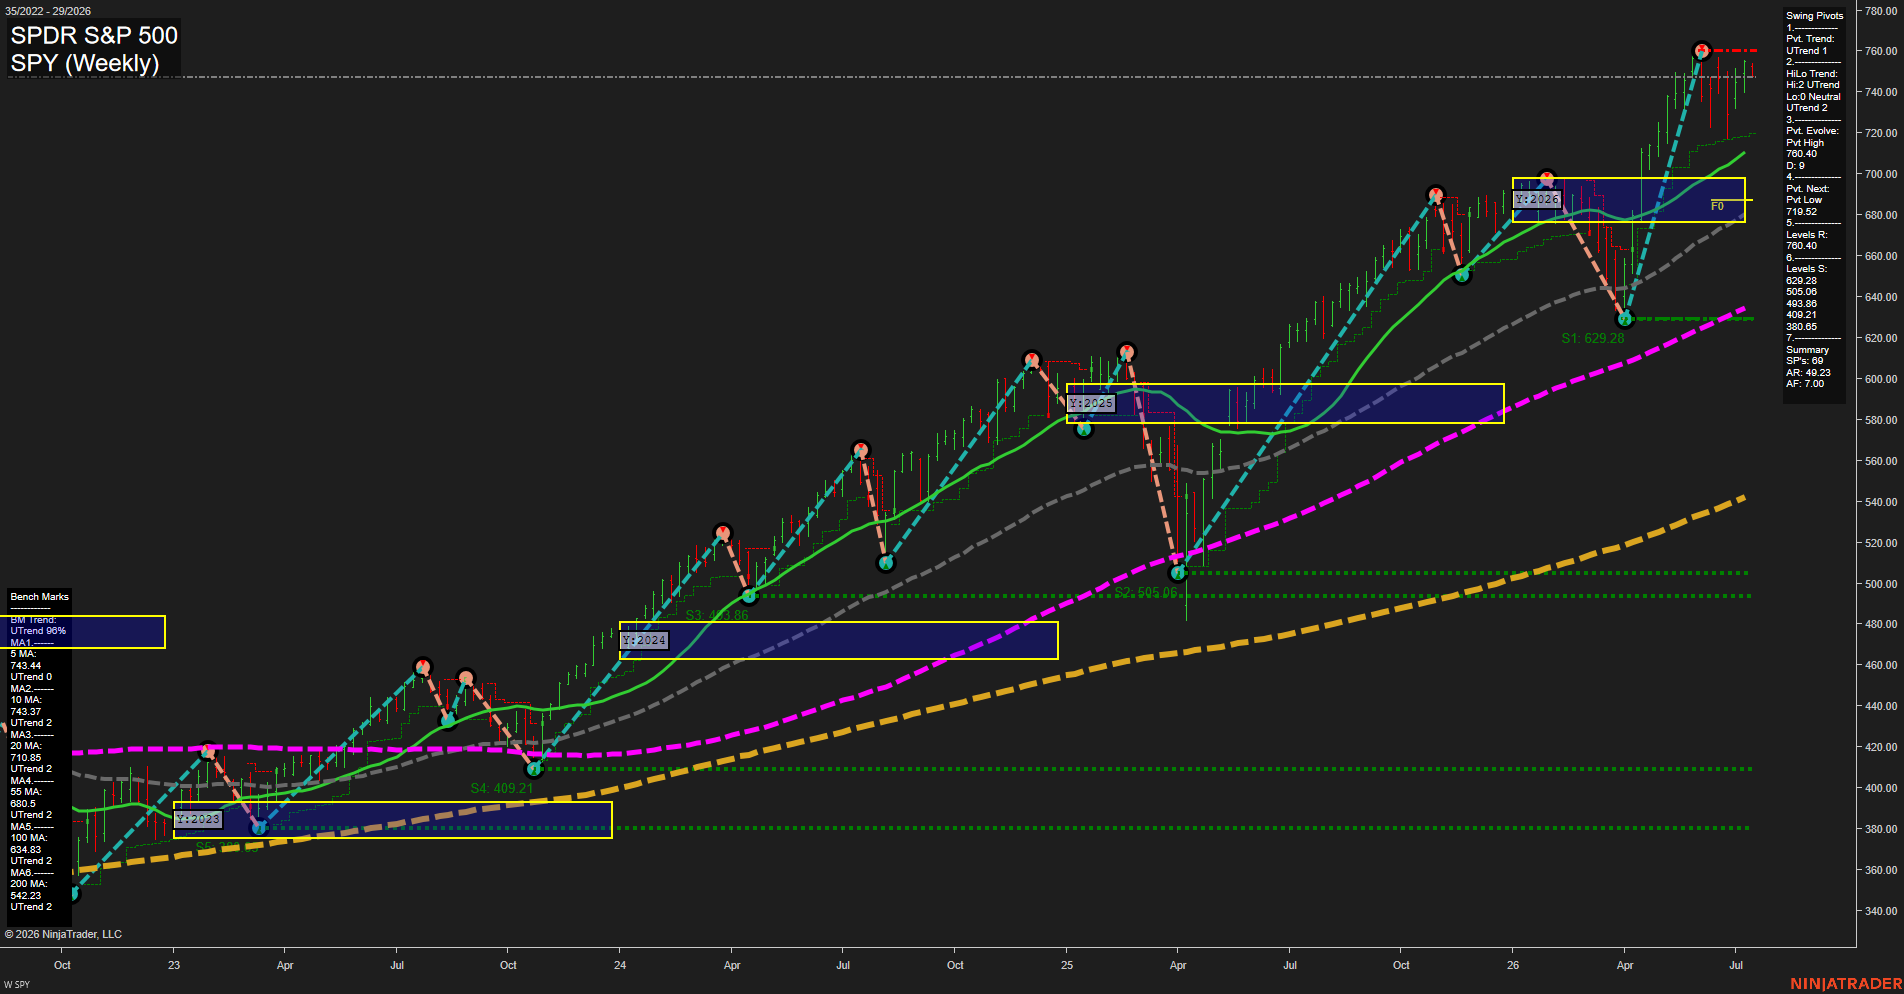
SPY SPDR S&P 500 Weekly Chart Analysis: 2026-Jul-14 07:07 CT
Price Action
- Last: 747.00,
- Bars: Large,
- Mom: fast.
WSFG Weekly
- Short-Term
- WSFG Current: NA%
- F0%/NTZ' Bias: Price Neutral,
- WSFG Trend: Neutral.
MSFG Month Jul
- Intermediate-Term
- MSFG Current: NA%
- F0%/NTZ' Bias: Price Neutral,
- MSFG Trend: Neutral.
YSFG Year 2026
- Long-Term
- YSFG Current: NA%
- F0%/NTZ' Bias: Price Neutral,
- YSFG Trend: Neutral.
Swing Pivots
- (Short-Term) 1. Pvt. Trend: UTrend,
- (Intermediate-Term) 2. HiLo Trend: UTrend,
- 3. Pvt. Evolve: Pvt High 760.40,
- 4. Pvt. Next: Pvt Low 719.52,
- 5. Levels R: 760.40,
- 6. Levels S: 629.28, 505.06, 493.86, 409.21, 380.65.
Weekly Benchmarks
- (Short-Term) 5 Day: 743.44 Up Trend,
- (Short-Term) 10 Day: 743.37 Up Trend,
- (Intermediate-Term) 20 Day: 710.85 Up Trend,
- (Intermediate-Term) 55 Day: 680.06 Up Trend,
- (Long-Term) 100 Day: 634.83 Up Trend,
- (Long-Term) 200 Day: 542.23 Up Trend.
Overall Rating
- Short-Term: Bullish,
- Intermediate-Term: Bullish,
- Long-Term: Bullish.
Key Insights Summary
SPY is holding a strong weekly uptrend with large-bar momentum and price positioned well above all major benchmarks, showing a mature trend structure rather than a mean-reversion setup. The pivot framework remains constructive with UTrend across both short- and intermediate-term swing measures, while the most recent pivot high near 760.40 marks the active upside reference. The 2026 price action is pressing into the upper part of the yearly NTZ area after a sharp advance, which reflects sustained trend continuation after prior consolidation and pullback phases. The moving average stack remains fully aligned upward, reinforcing a bullish trend regime across short, intermediate, and long horizons.
Chart Analysis ATS AI Generated: 2026-07-14 07:07 for Informational use only, not trading advice. Terms and Risk Disclosure Copyright © 2026. Algo Trading Systems LLC.