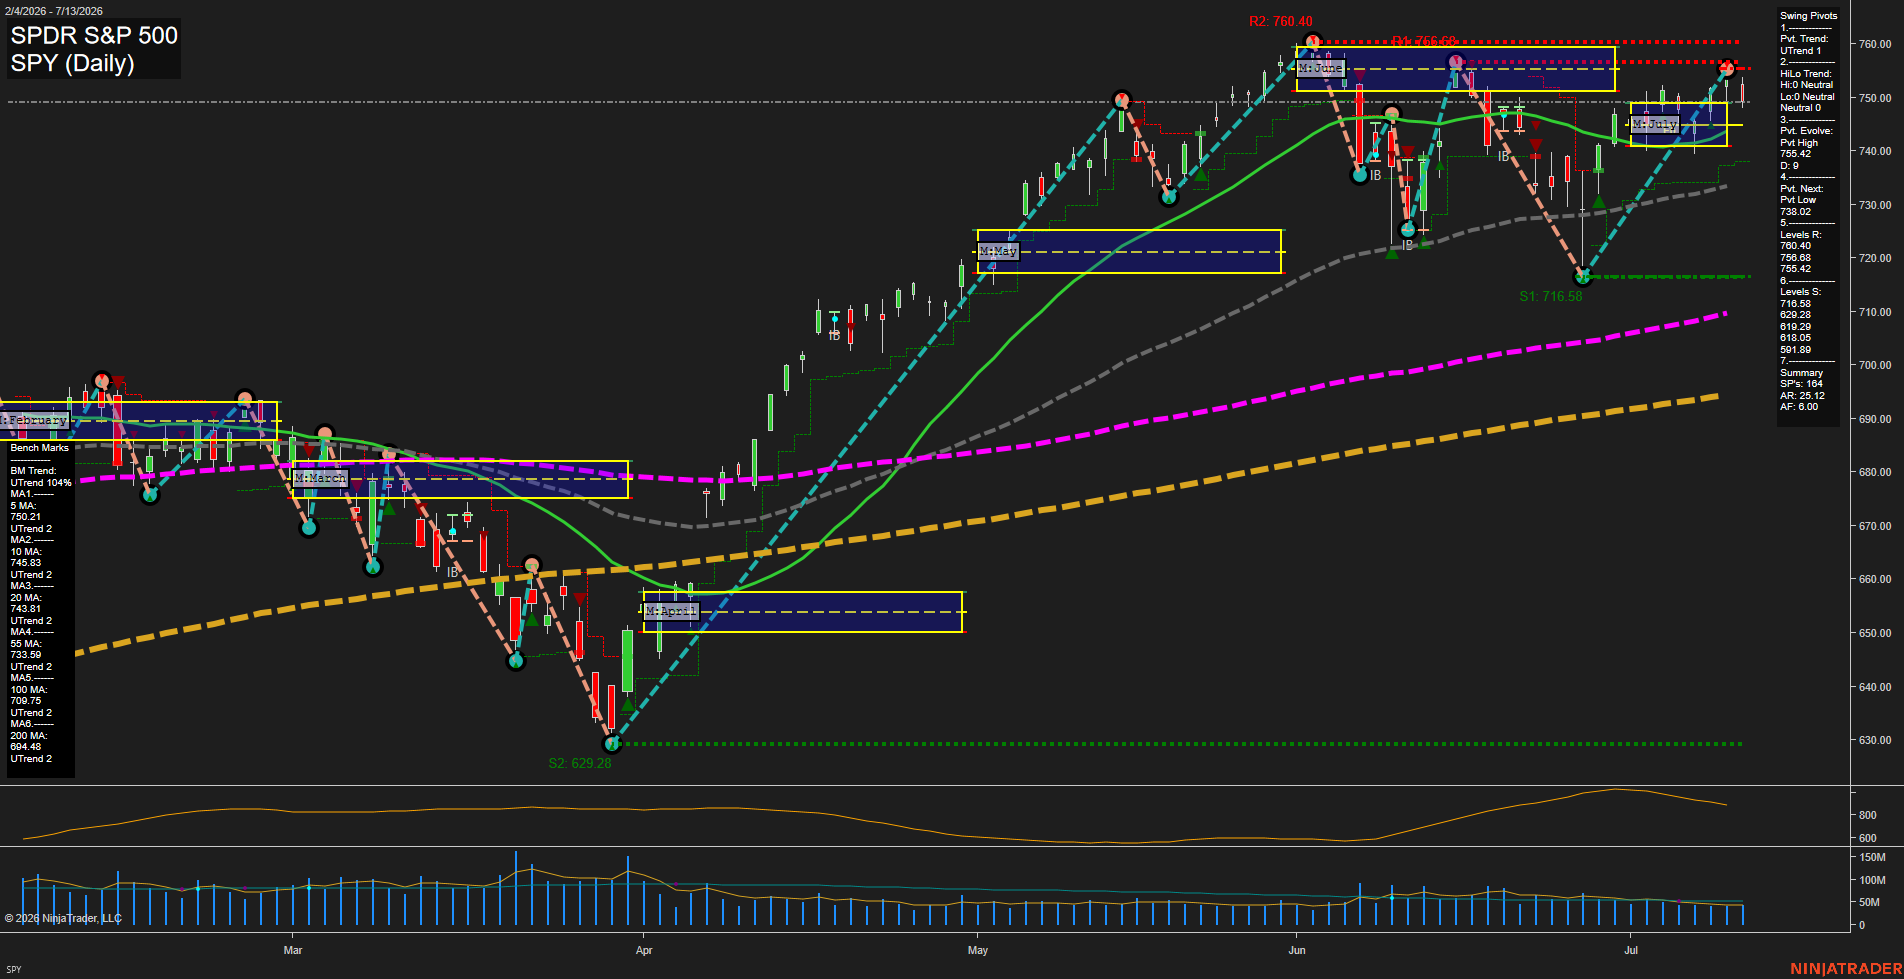
SPY SPDR S&P 500 Daily Chart Analysis: 2026-Jul-14 07:07 CT
Price Action
- Last: 755.42,
- Bars: Medium,
- Mom: fast.
WSFG Weekly
- Short-Term
- WSFG Current: NA%
- F0%/NTZ' Bias: Price Neutral,
- WSFG Trend: Neutral.
MSFG Month Jul
- Intermediate-Term
- MSFG Current: NA%
- F0%/NTZ' Bias: Price Neutral,
- MSFG Trend: Neutral.
YSFG Year 2026
- Long-Term
- YSFG Current: NA%
- F0%/NTZ' Bias: Price Neutral,
- YSFG Trend: Neutral.
Swing Pivots
- (Short-Term) 1. Pvt. Trend: UTrend,
- (Intermediate-Term) 2. HiLo Trend: UTrend,
- 3. Pvt. Evolve: Pvt High 755.42,
- 4. Pvt. Next: Pvt Low 738.02,
- 5. Levels R: 760.40, 756.68, 755.42,
- 6. Levels S: 716.58, 629.28, 619.29, 618.05, 591.89.
Daily Benchmarks
- (Short-Term) 5 Day: 750.21 Up Trend,
- (Short-Term) 10 Day: 745.83 Up Trend,
- (Intermediate-Term) 20 Day: 743.81 Up Trend,
- (Intermediate-Term) 55 Day: 733.59 Up Trend,
- (Long-Term) 100 Day: 709.75 Up Trend,
- (Long-Term) 200 Day: 694.48 Up Trend.
Additional Metrics
- ATR: 564,
- VOLMA: 47470907.
Overall Rating
- Short-Term: Bullish,
- Intermediate-Term: Bullish,
- Long-Term: Bullish.
Key Insights Summary
SPY is pressing into the upper end of the current swing range with price holding above all benchmark moving averages, which keeps the trend structure aligned to the upside across short, intermediate, and long horizons. The pivot map shows an active UTrend with the most recent evolution still marked as a pivot high, while the next reversal point remains lower at 738.02, highlighting that the dominant structure is a higher-high / higher-low advance with nearby overhead resistance at 756.68 and 760.40. The monthly fib grid is neutral by summary, so the move is occurring inside a broader equilibrium zone rather than a clean stretched breakout environment, but the price location near the highs and the stacked moving averages support continuation bias. Volume/volatility metrics indicate an active tape, and the recent sequence suggests a strong rally phase with periodic pullbacks and quick rebounds rather than sustained rejection, keeping the chart in a constructive bullish swing condition.
Chart Analysis ATS AI Generated: 2026-07-14 07:07 for Informational use only, not trading advice. Terms and Risk Disclosure Copyright © 2026. Algo Trading Systems LLC.