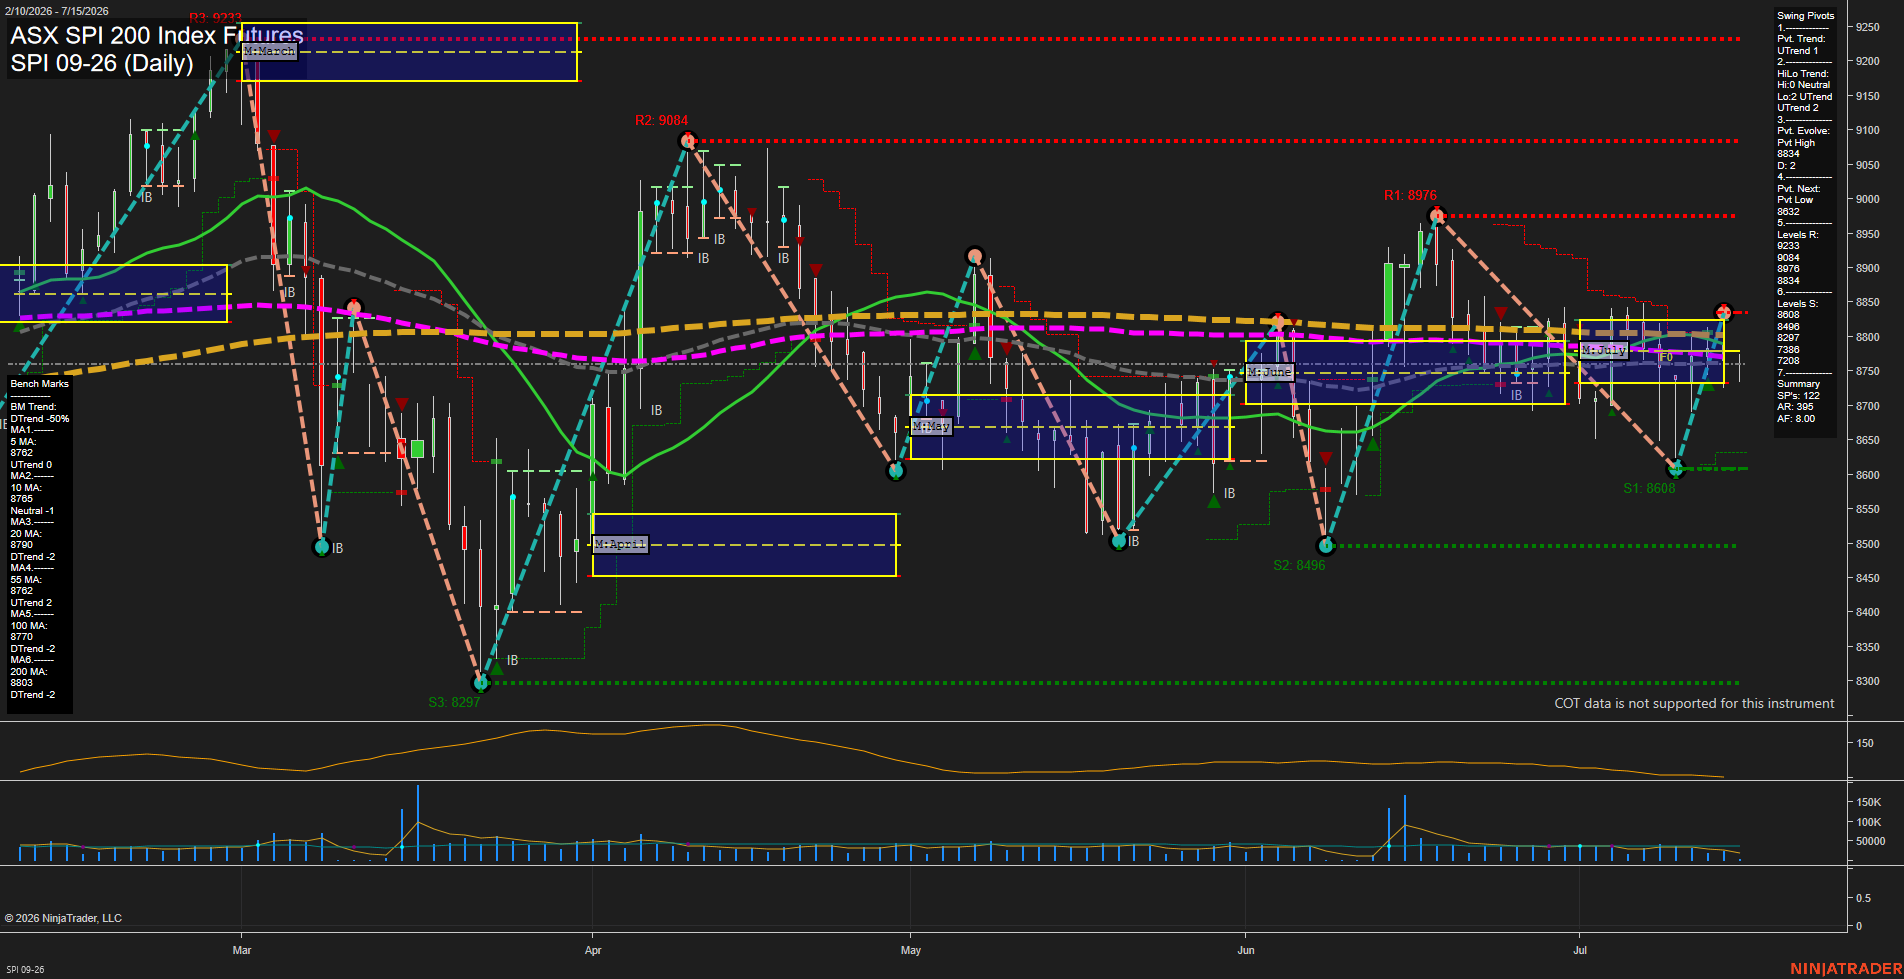
SPI ASX SPI 200 Index Futures Daily Chart Analysis: 2026-Jul-14 07:06 CT
Price Action
- Last: 8770,
- Bars: Medium,
- Mom: slow.
WSFG Weekly
- Short-Term
- WSFG Current: NA%
- F0%/NTZ' Bias: Price Neutral,
- WSFG Trend: Neutral.
MSFG Month Jul
- Intermediate-Term
- MSFG Current: NA%
- F0%/NTZ' Bias: Price Neutral,
- MSFG Trend: Neutral.
YSFG Year 2026
- Long-Term
- YSFG Current: NA%
- F0%/NTZ' Bias: Price Neutral,
- YSFG Trend: Neutral.
Swing Pivots
- (Short-Term) 1. Pvt. Trend: UTrend,
- (Intermediate-Term) 2. HiLo Trend: UTrend,
- 3. Pvt. Evolve: Pvt High 8834,
- 4. Pvt. Next: Pvt Low 8632,
- 5. Levels R: 9233, 9084, 8976, 8834,
- 6. Levels S: 8608, 8496, 8297, 7386, 7208.
Daily Benchmarks
- (Short-Term) 5 Day: 8762 Up Trend,
- (Short-Term) 10 Day: 8765 Down Trend,
- (Intermediate-Term) 20 Day: 8790 Down Trend,
- (Intermediate-Term) 55 Day: 8762 Up Trend,
- (Long-Term) 100 Day: 8770 Down Trend,
- (Long-Term) 200 Day: 8803 Down Trend.
Additional Metrics
Overall Rating
- Short-Term: Bullish,
- Intermediate-Term: Neutral,
- Long-Term: Bearish.
Key Insights Summary
Price is holding in a broad rotational range after the June-to-July recovery, with the daily structure still marked by alternating swing highs and swing lows rather than a clean trend expansion. The short-term pivot trend remains upward and price is sitting near the benchmark cluster, while the intermediate picture is mixed with the 20-day and 100-day measures still leaning lower. The July MSFG zone appears balanced around the current price, reinforcing a neutral month-to-date posture. Overhead resistance remains defined by the 8834 pivot high, then 8976 and 9084, while support is layered at 8608, 8496, and 8297. The chart reflects a consolidation regime with recent tests and rejections around the upper range, and the longer benchmarks still capping the broader tone.
Chart Analysis ATS AI Generated: 2026-07-14 07:06 for Informational use only, not trading advice. Terms and Risk Disclosure Copyright © 2026. Algo Trading Systems LLC.