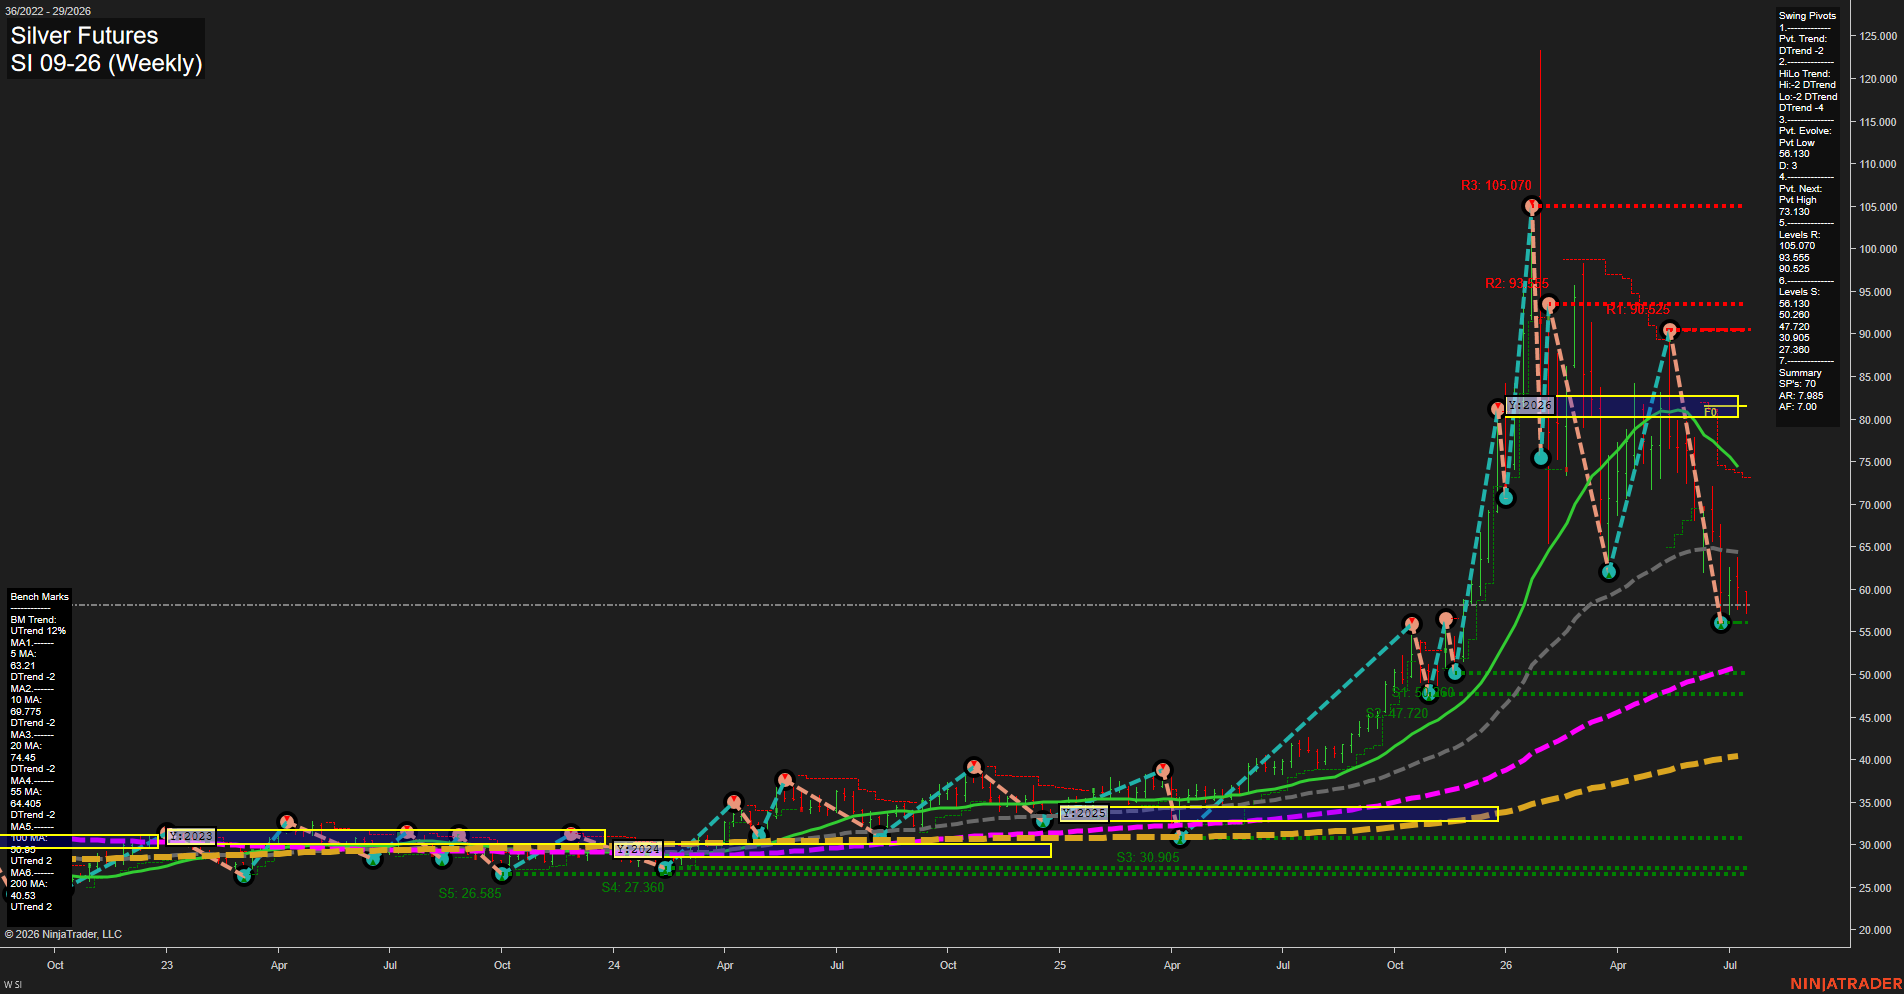
SI Silver Futures Weekly Chart Analysis: 2026-Jul-14 07:06 CT
Price Action
- Last: 58.49,
- Bars: Large,
- Mom: fast.
WSFG Weekly
- Short-Term
- WSFG Current: -16%
- F0%/NTZ' Bias: Price Below,
- WSFG Trend: Down.
MSFG Month Jul
- Intermediate-Term
- MSFG Current: 1%
- F0%/NTZ' Bias: Price Above,
- MSFG Trend: Up.
YSFG Year 2026
- Long-Term
- YSFG Current: -187%
- F0%/NTZ' Bias: Price Below,
- YSFG Trend: Down.
Swing Pivots
- (Short-Term) 1. Pvt. Trend: DTrend,
- (Intermediate-Term) 2. HiLo Trend: DTrend,
- 3. Pvt. Evolve: Pvt Low 56.130,
- 4. Pvt. Next: Pvt High 73.130,
- 5. Levels R: 105.070, 93.555, 90.525,
- 6. Levels S: 56.130, 50.260, 47.720, 30.905, 27.360, 26.585.
Weekly Benchmarks
- (Short-Term) 5 Day: 63.21 Down Trend,
- (Short-Term) 10 Day: 69.775 Down Trend,
- (Intermediate-Term) 20 Day: 74.45 Down Trend,
- (Intermediate-Term) 55 Day: 64.405 Down Trend,
- (Long-Term) 100 Day: 50.93 Up Trend,
- (Long-Term) 200 Day: 40.53 Up Trend.
Recent Trade Signals
- 14 Jul 2026: Short SI 09-26 @ 58.49 Signals.USAR-WSFG
- 10 Jul 2026: Long SI 09-26 @ 60.38 Signals.USAR-MSFG
- 09 Jul 2026: Long SI 09-26 @ 60.765 Signals.USAR.TR120
Overall Rating
- Short-Term: Bearish,
- Intermediate-Term: Bullish,
- Long-Term: Bearish.
Key Insights Summary
Silver is in a sharp weekly pullback after a powerful run into the 90s and above 100, with the current bar pressing back below the weekly NTZ and the short-term pivot structure now confirming a downtrend. The weekly session grid is negative and the latest short signal aligns with that weakness, while the monthly grid still holds a constructive up bias from the prior breakout base. Price has fallen under the clustered shorter benchmarks, but it remains above the deeper long-term structure around the 50s and 40s, which keeps the broader chart from looking fully broken. Pivot resistance is layered overhead at 73.130, 90.525, 93.555, and 105.070, while support is stacked at 56.130, 50.260, 47.720, then lower historical levels near 30.905 and 27.360. The weekly look is therefore choppy-to-bearish near term, with the larger frame still reflecting a post-spike correction inside a broader long-cycle downtrend.
Chart Analysis ATS AI Generated: 2026-07-14 07:06 for Informational use only, not trading advice. Terms and Risk Disclosure Copyright © 2026. Algo Trading Systems LLC.