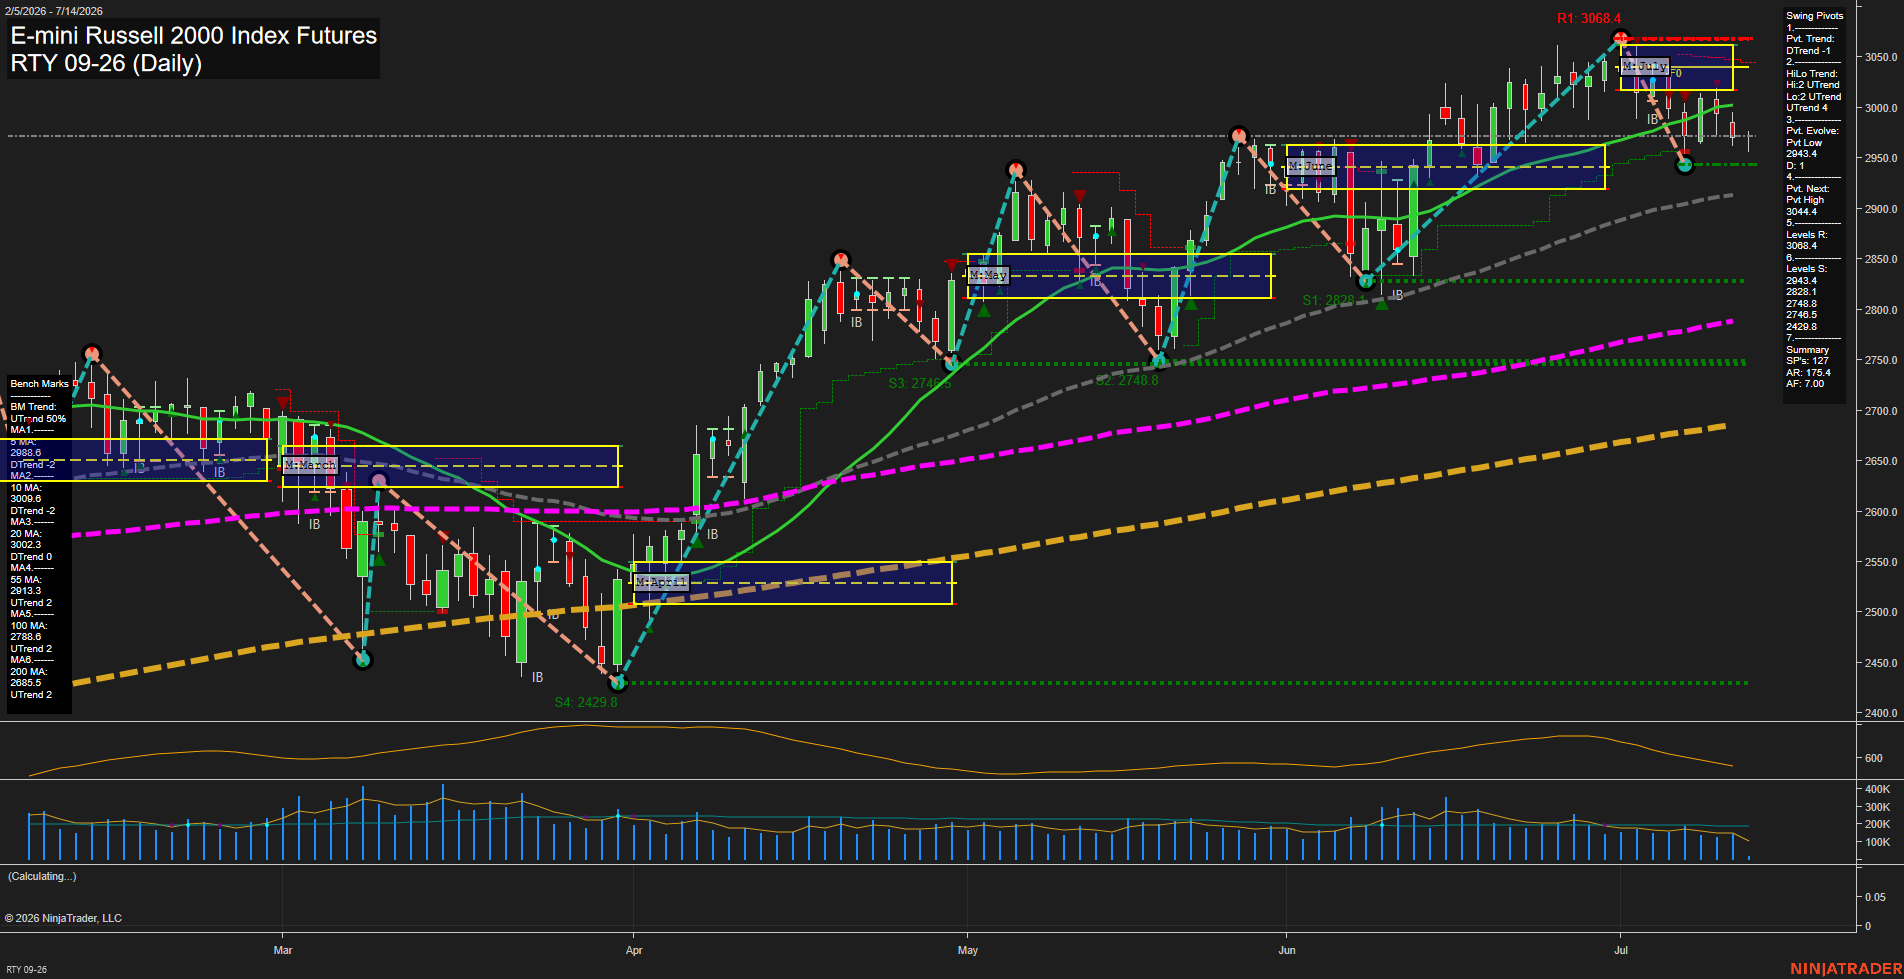
RTY E-mini Russell 2000 Index Futures Daily Chart Analysis: 2026-Jul-14 07:06 CT
Price Action
- Last: 2965.5,
- Bars: Small,
- Mom: slow.
WSFG Weekly
- Short-Term
- WSFG Current: -15%
- F0%/NTZ' Bias: Price Below,
- WSFG Trend: Down.
MSFG Month Jul
- Intermediate-Term
- MSFG Current: -25%
- F0%/NTZ' Bias: Price Below,
- MSFG Trend: Down.
YSFG Year 2026
- Long-Term
- YSFG Current: 67%
- F0%/NTZ' Bias: Price Above,
- YSFG Trend: Up.
Swing Pivots
- (Short-Term) 1. Pvt. Trend: DTrend,
- (Intermediate-Term) 2. HiLo Trend: UTrend,
- 3. Pvt. Evolve: Pvt Low 2943.4,
- 4. Pvt. Next: Pvt High 3044.4,
- 5. Levels R: 3068.4,
- 6. Levels S: 2943.4, 2828.1, 2748.8, 2429.8.
Daily Benchmarks
- (Short-Term) 5 Day: 2988.6 Down Trend,
- (Short-Term) 10 Day: 3009.6 Down Trend,
- (Intermediate-Term) 20 Day: 3002.3 Down Trend,
- (Intermediate-Term) 55 Day: 2913.3 Up Trend,
- (Long-Term) 100 Day: 2788.6 Up Trend,
- (Long-Term) 200 Day: 2685.5 Up Trend.
Additional Metrics
Recent Trade Signals
- 14 Jul 2026: Short RTY 09-26 @ 2965.5 Signals.USAR-WSFG
- 13 Jul 2026: Short RTY 09-26 @ 2965.4 Signals.USAR.TR120
- 13 Jul 2026: Short RTY 09-26 @ 2985 Signals.USAR-MSFG
Overall Rating
- Short-Term: Bearish,
- Intermediate-Term: Neutral,
- Long-Term: Bullish.
Key Insights Summary
RTY is sitting below the weekly and monthly fib midlines, keeping the near-term structure under pressure and aligned with the current short-term pivot downtrend. The daily swing map still shows a lower pivot evolution at 2943.4 with resistance clustered at 3068.4 and layered support stepping down through 2943.4, 2828.1, 2748.8, and 2429.8, which fits a market that has already completed a strong advance and is now consolidating near the upper-middle part of the larger range. The 5, 10, and 20 day benchmarks are all trending lower, while price remains above the 55, 100, and 200 day averages, so the intermediate and long-term backdrop remains constructive despite the current pullback. The pattern reads as a post-rally pause with failed retests near the recent highs, inside-bar type compression, and rotation back toward the rising longer-term average structure.
Chart Analysis ATS AI Generated: 2026-07-14 07:06 for Informational use only, not trading advice. Terms and Risk Disclosure Copyright © 2026. Algo Trading Systems LLC.