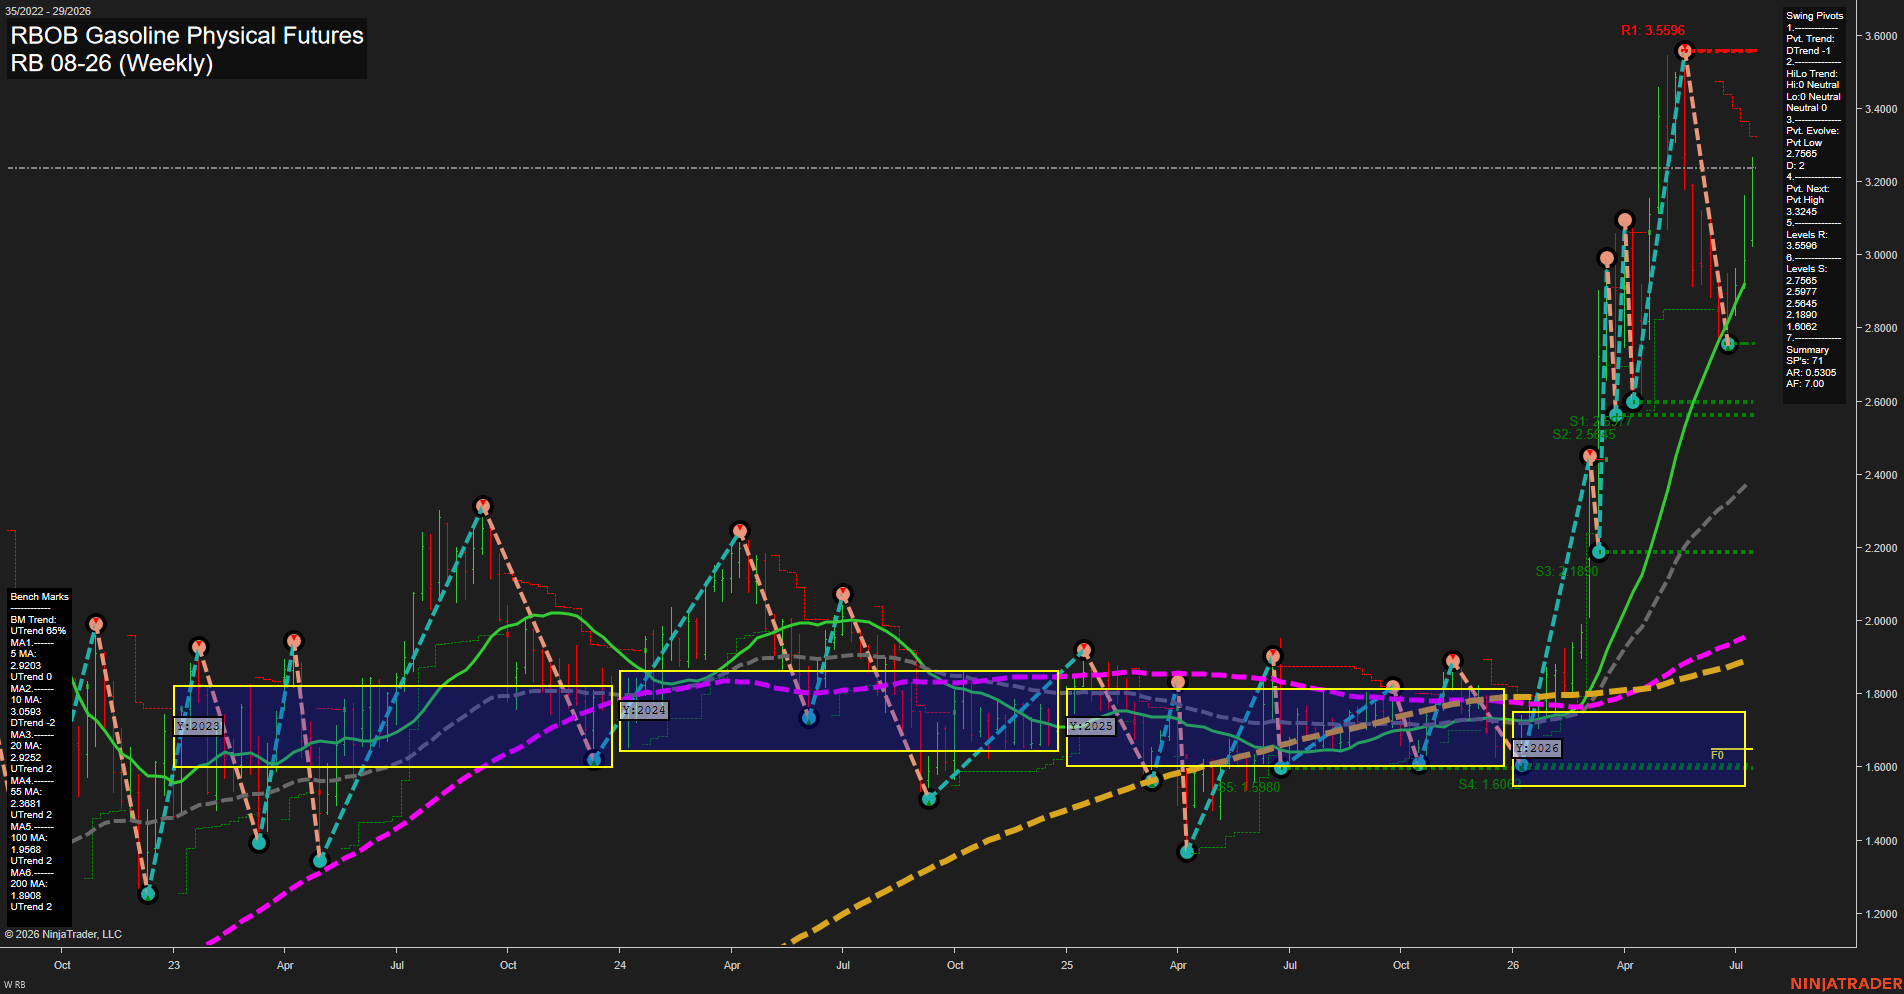
RB RBOB Gasoline Physical Futures Weekly Chart Analysis: 2026-Jul-14 07:05 CT
Price Action
- Last: 2.7750,
- Bars: Large,
- Mom: fast.
WSFG Weekly
- Short-Term
- WSFG Current: 104%
- F0%/NTZ' Bias: Price Above,
- WSFG Trend: Up.
MSFG Month Jul
- Intermediate-Term
- MSFG Current: 51%
- F0%/NTZ' Bias: Price Above,
- MSFG Trend: Up.
YSFG Year 2026
- Long-Term
- YSFG Current: 157%
- F0%/NTZ' Bias: Price Above,
- YSFG Trend: Up.
Swing Pivots
- (Short-Term) 1. Pvt. Trend: DTrend,
- (Intermediate-Term) 2. HiLo Trend: UTrend,
- 3. Pvt. Evolve: Pvt Low 2.7565,
- 4. Pvt. Next: Pvt High 3.3245,
- 5. Levels R: 3.5596,
- 6. Levels S: 2.7565, 2.5977, 2.5845, 2.1890, 1.6062.
Weekly Benchmarks
- (Short-Term) 5 Day: 2.9203 Up Trend,
- (Short-Term) 10 Day: 3.0593 Down Trend,
- (Intermediate-Term) 20 Day: 2.9252 Up Trend,
- (Intermediate-Term) 55 Day: 2.3831 Up Trend,
- (Long-Term) 100 Day: 1.9568 Up Trend,
- (Long-Term) 200 Day: 1.8808 Up Trend.
Recent Trade Signals
- 13 Jul 2026: Long RB 08-26 @ 3.0581 Signals.USAR-WSFG
- 13 Jul 2026: Long RB 08-26 @ 3.0581 Signals.USAR-MSFG
- 09 Jul 2026: Short RB 08-26 @ 3.0249 Signals.USAR.TR120
- 08 Jul 2026: Long RB 08-26 @ 3.1457 Signals.USAR.TR720
Overall Rating
- Short-Term: Neutral,
- Intermediate-Term: Bullish,
- Long-Term: Bullish.
Key Insights Summary
Weekly RB RBOB gasoline remains in a strong higher-timeframe uptrend, with price holding well above the yearly, monthly, and weekly fib grid midpoint zones and the 20/55/100/200-day benchmarks all pointing higher. The recent vertical rally pushed into new highs near 3.56 before pulling back sharply, leaving the short-term pivot structure in a DTrend state while the broader HiLo backdrop is still constructive. The current weekly action reflects a fast, large-range expansion off a prior base, followed by a volatile retracement back toward the 2.75 to 2.60 support shelf. Recent signal flow shows both weekly and monthly long triggers still active, while the short-term TR120 turned short during the pullback, creating a mixed near-term swing profile inside an otherwise bullish intermediate and long-term trend.
Chart Analysis ATS AI Generated: 2026-07-14 07:06 for Informational use only, not trading advice. Terms and Risk Disclosure Copyright © 2026. Algo Trading Systems LLC.