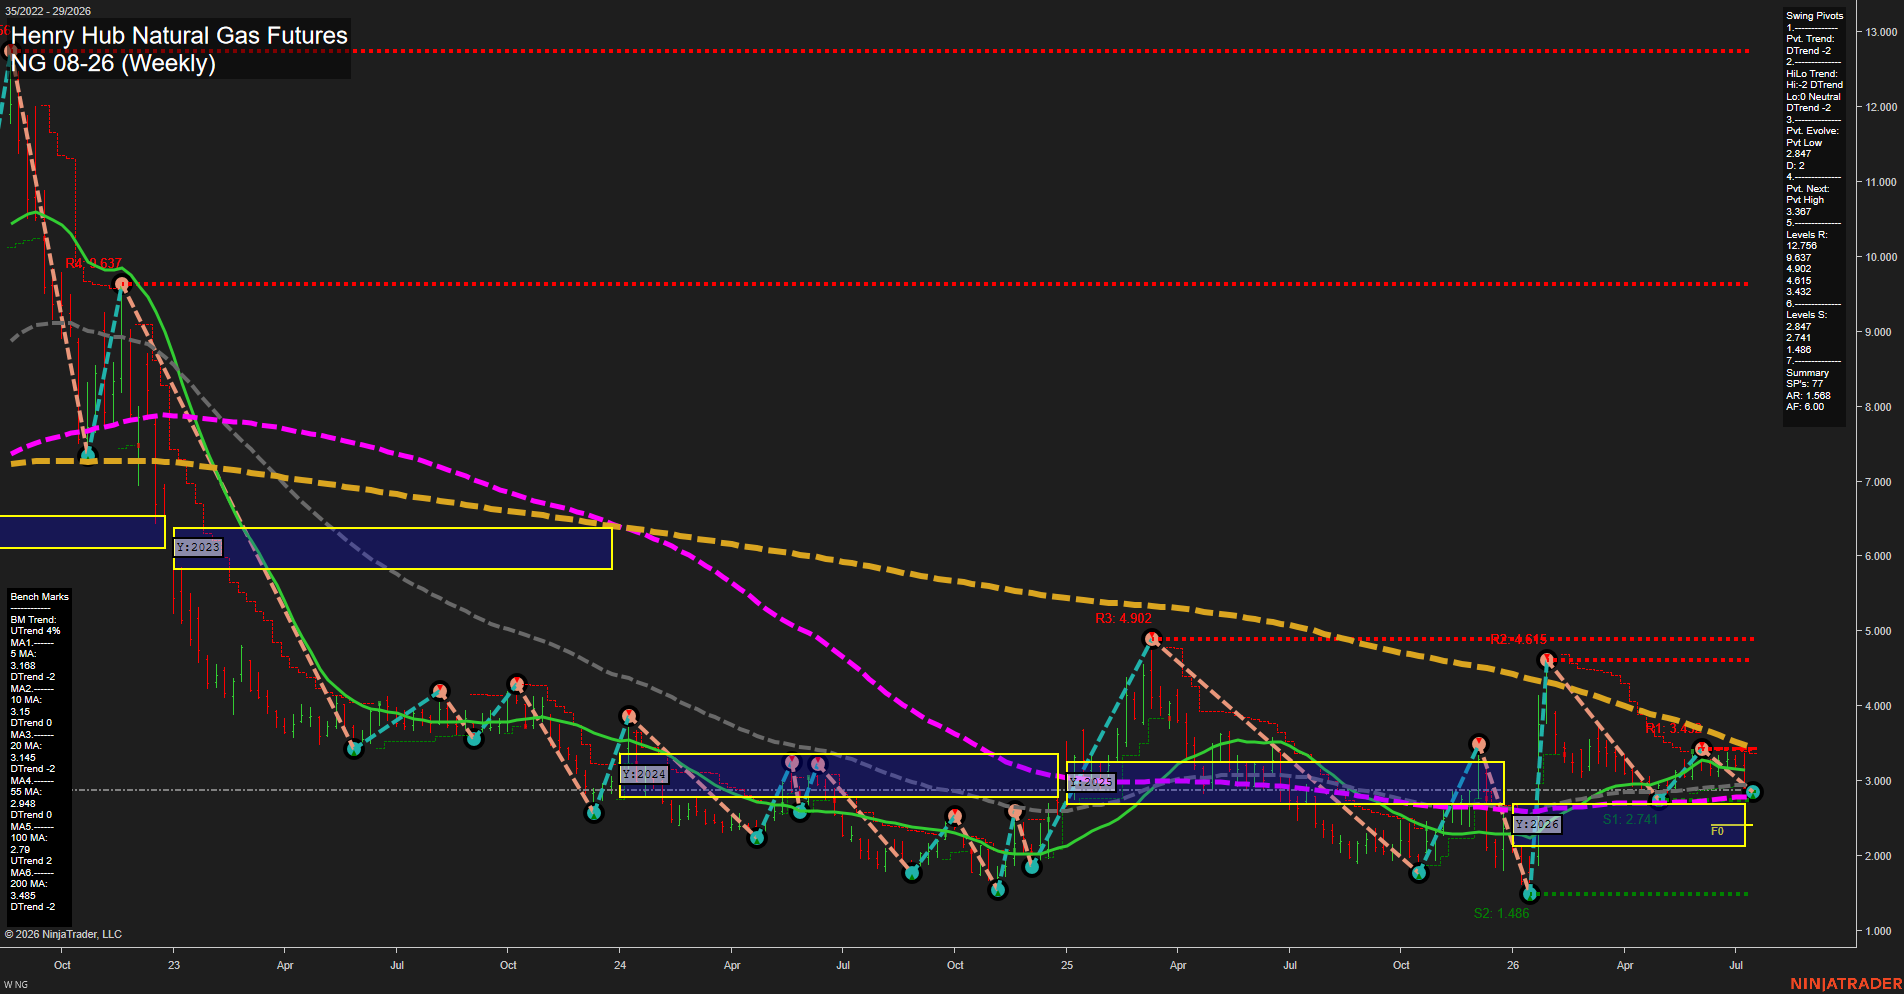
NG Henry Hub Natural Gas Futures Weekly Chart Analysis: 2026-Jul-14 07:04 CT
Price Action
- Last: 2.847,
- Bars: Medium,
- Mom: slow.
WSFG Weekly
- Short-Term
- WSFG Current: -22%
- F0%/NTZ' Bias: Price Below,
- WSFG Trend: Down.
MSFG Month Jul
- Intermediate-Term
- MSFG Current: -83%
- F0%/NTZ' Bias: Price Below,
- MSFG Trend: Down.
YSFG Year 2026
- Long-Term
- YSFG Current: 16%
- F0%/NTZ' Bias: Price Above,
- YSFG Trend: Up.
Swing Pivots
- (Short-Term) 1. Pvt. Trend: DTrend,
- (Intermediate-Term) 2. HiLo Trend: DTrend,
- 3. Pvt. Evolve: Pvt Low 2.847,
- 4. Pvt. Next: Pvt High 5.387,
- 5. Levels R: 12.756, 9.637, 4.902, 4.615, 3.432,
- 6. Levels S: 2.847, 2.741, 1.486.
Weekly Benchmarks
- (Short-Term) 5 Day: 3.168 Down Trend,
- (Short-Term) 10 Day: 3.150 Down Trend,
- (Intermediate-Term) 20 Day: 3.145 Down Trend,
- (Intermediate-Term) 55 Day: 2.948 Down Trend,
- (Long-Term) 100 Day: 2.790 Up Trend,
- (Long-Term) 200 Day: 3.485 Down Trend.
Recent Trade Signals
- 14 Jul 2026: Short NG 08-26 @ 2.884 Signals.USAR-WSFG
- 09 Jul 2026: Short NG 08-26 @ 3.03 Signals.USAR.TR720
- 09 Jul 2026: Short NG 08-26 @ 3.203 Signals.USAR-MSFG
- 07 Jul 2026: Long NG 08-26 @ 3.272 Signals.USAR.TR120
Overall Rating
- Short-Term: Bearish,
- Intermediate-Term: Bearish,
- Long-Term: Neutral.
Key Insights Summary
Natural gas remains in a larger down-cycle on the weekly swing structure, with price sitting near the 2.847 pivot low and below the short/intermediate benchmark cluster. The weekly and monthly session fib grids are both below F0%/NTZ and aligned with downside bias, which keeps the short-term and intermediate-term tone weak. Pivot structure is still DTrend on both the short-term and HiLo trend read, showing lower-high/lower-low behavior after the sharp 2025 spike and subsequent fade. The benchmark stack is mixed but still heavy overall, with the 5, 10, 20, and 55 week averages trending lower and price pressing under them; only the 100 day benchmark is rising, giving the long-term picture a more neutral-to-slightly constructive backdrop. The yearly grid remains above F0%/NTZ, so the broader 2026 context has not fully broken down even though the recent swing sequence is bearish. Recent signals reinforce that split, with fresh short signals dominating the latest short, intermediate, and long swing reads, while the earlier long signal has already been overtaken by the current decline and consolidation around the lower pivot zone.
Chart Analysis ATS AI Generated: 2026-07-14 07:04 for Informational use only, not trading advice. Terms and Risk Disclosure Copyright © 2026. Algo Trading Systems LLC.