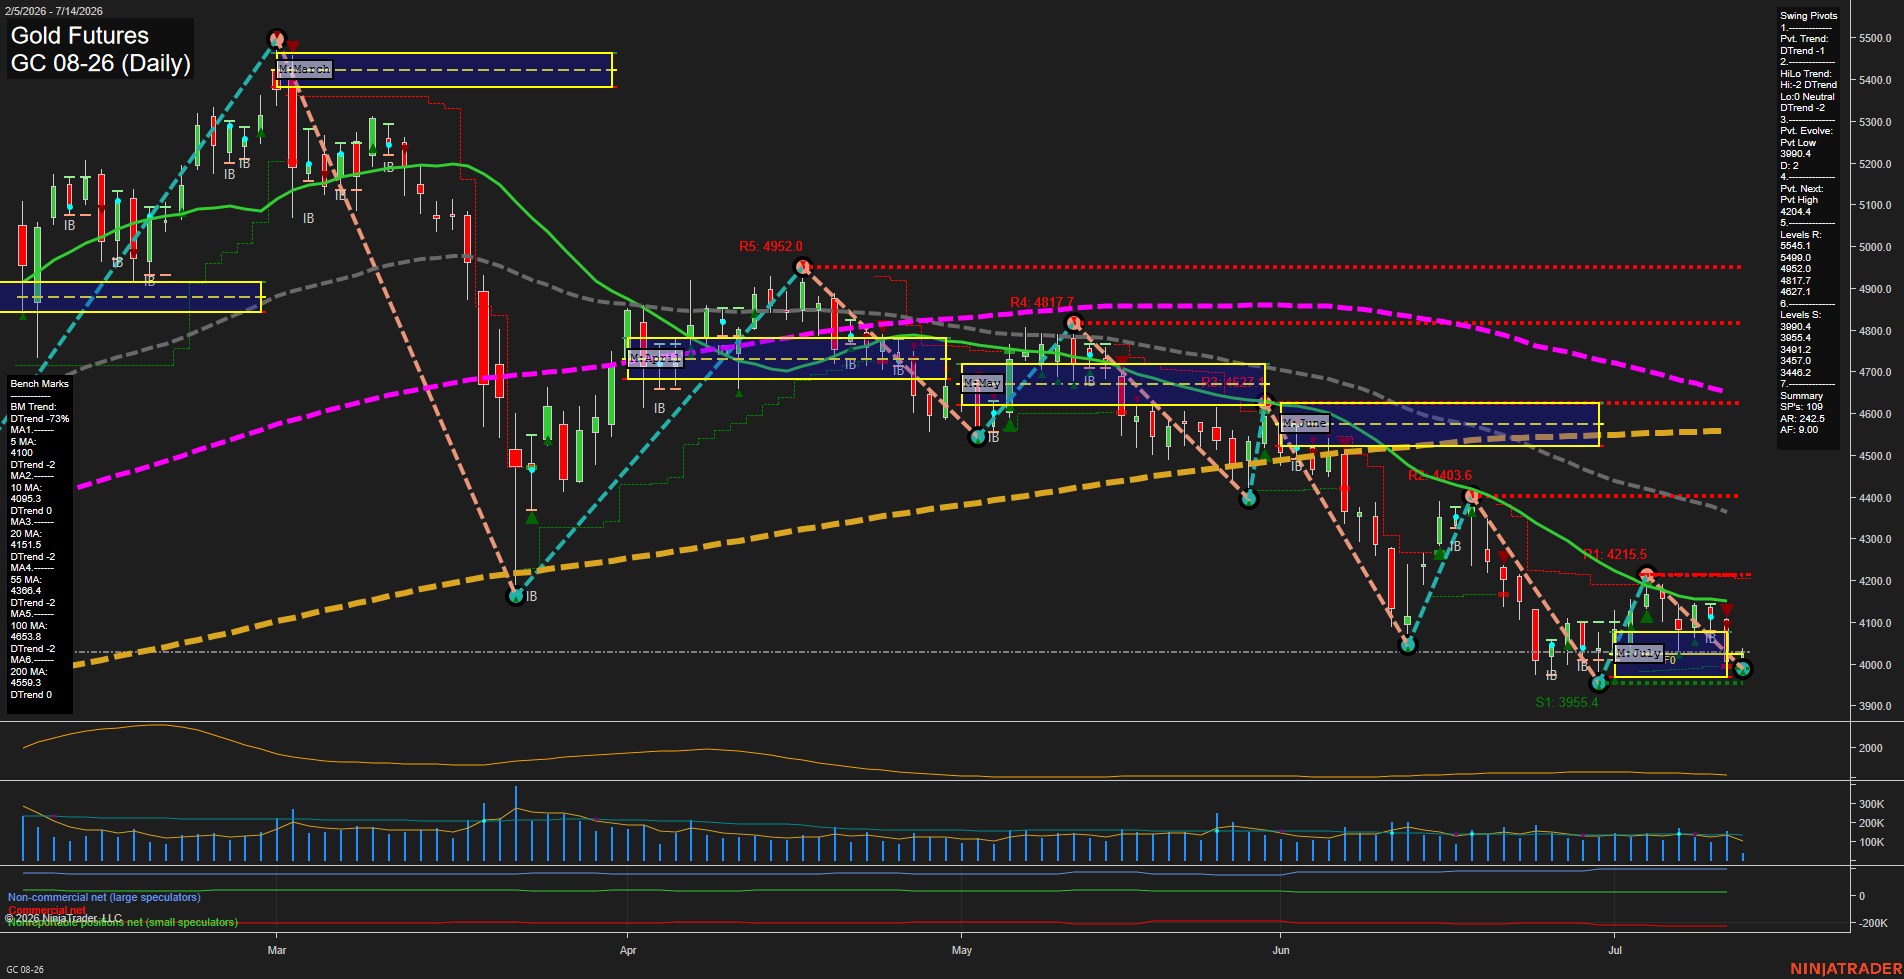
GC Gold Futures Daily Chart Analysis: 2026-Jul-14 07:03 CT
Price Action
- Last: 3970.0,
- Bars: Large,
- Mom: Fast.
WSFG Weekly
- Short-Term
- WSFG Current: -28%
- F0%/NTZ' Bias: Price Below,
- WSFG Trend: Down.
MSFG Month Jul
- Intermediate-Term
- MSFG Current: 8%
- F0%/NTZ' Bias: Price Above,
- MSFG Trend: Up.
YSFG Year 2026
- Long-Term
- YSFG Current: -122%
- F0%/NTZ' Bias: Price Below,
- YSFG Trend: Down.
Swing Pivots
- (Short-Term) 1. Pvt. Trend: DTrend,
- (Intermediate-Term) 2. HiLo Trend: DTrend,
- 3. Pvt. Evolve: Pvt Low 3990.4,
- 4. Pvt. Next: Pvt High 4204.4,
- 5. Levels R: 5545.1, 5499.0, 4952.0, 4817.7, 4627.1,
- 6. Levels S: 3900.4, 3955.4, 3491.2, 3457.0, 3446.2.
Daily Benchmarks
- (Short-Term) 5 Day: 4100.0 Down Trend,
- (Short-Term) 10 Day: 4095.3 Down Trend,
- (Intermediate-Term) 20 Day: 4151.5 Down Trend,
- (Intermediate-Term) 55 Day: 4368.4 Down Trend,
- (Long-Term) 100 Day: 4653.3 Down Trend,
- (Long-Term) 200 Day: 4559.3 Down Trend.
Additional Metrics
Recent Trade Signals
- 13 Jul 2026: Short GC 08-26 @ 4066.4 Signals.USAR-WSFG
- 10 Jul 2026: Long GC 08-26 @ 4122.4 Signals.USAR-MSFG
Overall Rating
- Short-Term: Bearish,
- Intermediate-Term: Bearish,
- Long-Term: Bearish.
Key Insights Summary
Gold futures are trading in a sharply lower daily swing structure after a fast selloff from the 4200 area and a continued sequence of lower highs and lower lows. Price is now pressed under the key daily benchmark stack, with all major moving averages pointed lower and overhead resistance layered at 4095 to 4151 and then 4368. The weekly session fib remains below its F0%/NTZ reference, matching the short-term downtrend, while the monthly session fib still sits above its F0%/NTZ and keeps the intermediate-term view mixed-to-firmer relative to the broader decline. The swing pivot map remains bearish with DTrend active, support clustered near 3955 and 3900, and the next major pivot high still well above at 4204. Recent trade signals reflect the alternating reaction to the July range, but the broader tape remains dominated by downside momentum, heavy volatility, and a consolidation-to-breakdown character after repeated rejection near prior reaction highs.
Chart Analysis ATS AI Generated: 2026-07-14 07:04 for Informational use only, not trading advice. Terms and Risk Disclosure Copyright © 2026. Algo Trading Systems LLC.