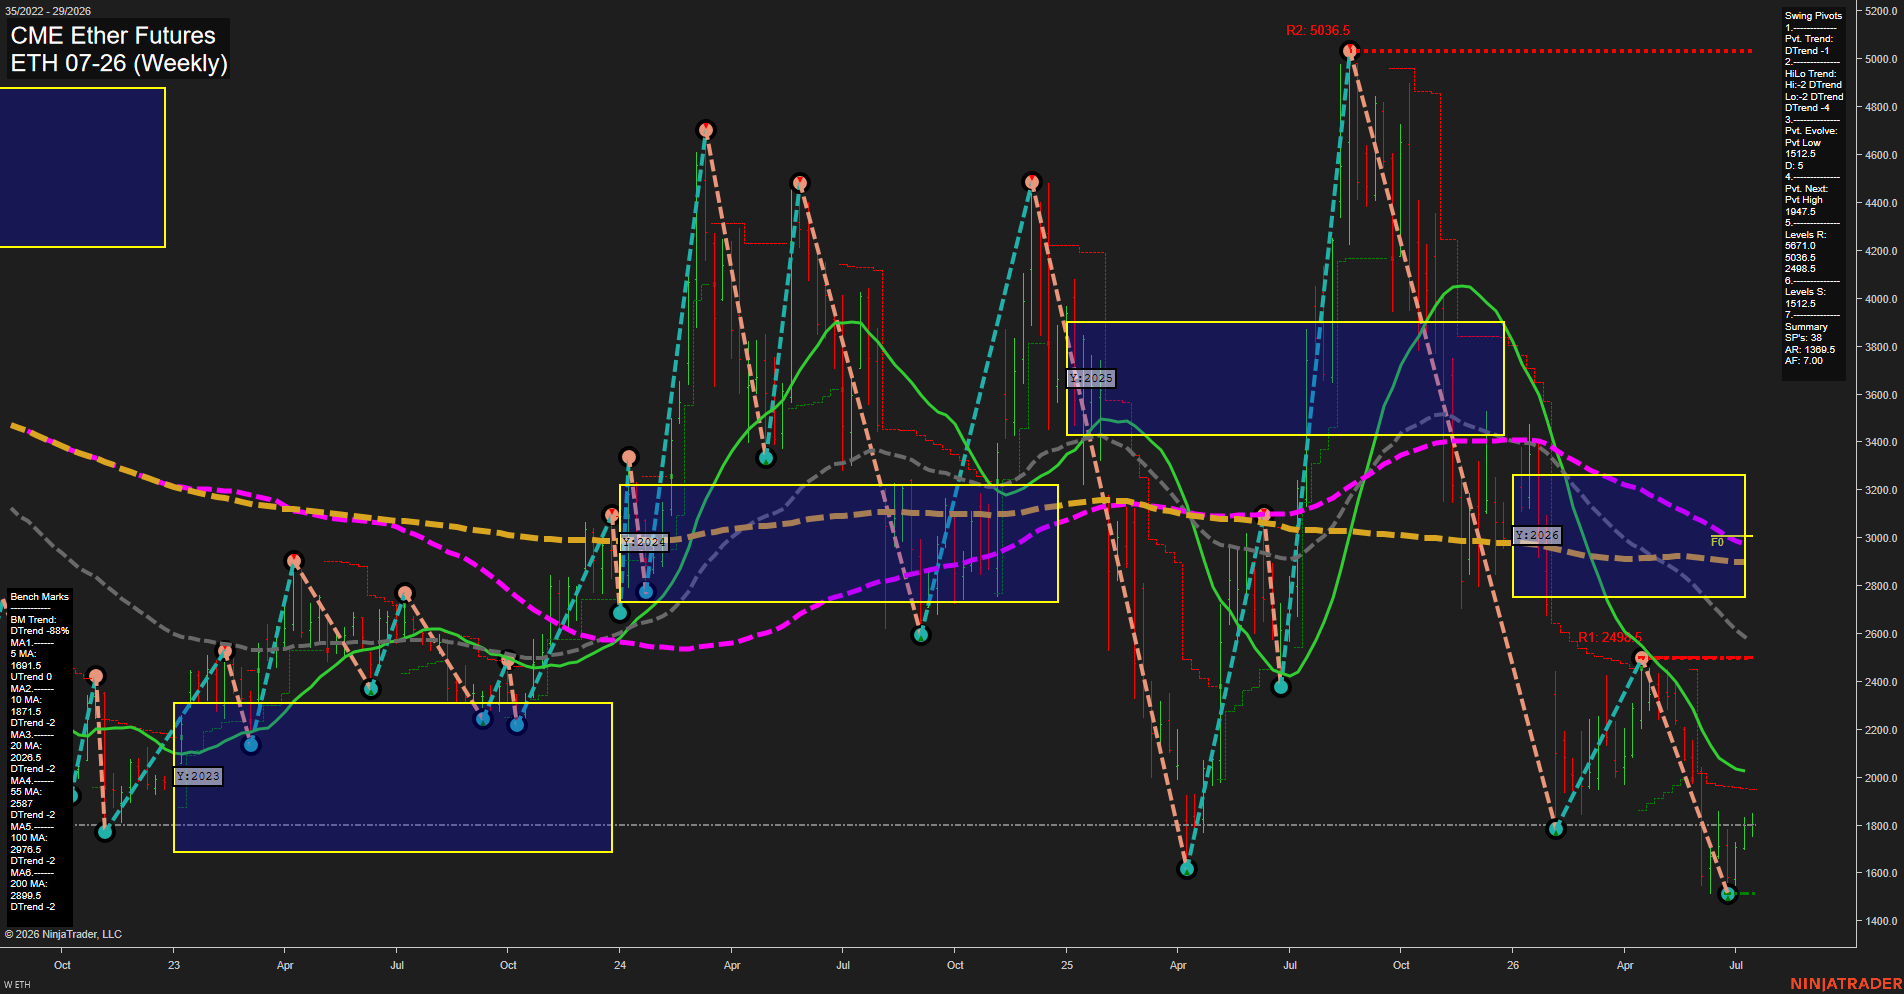
ETH CME Ether Futures Weekly Chart Analysis: 2026-Jul-14 07:03 CT
Price Action
- Last: 1786.5,
- Bars: Large,
- Mom: Fast.
WSFG Weekly
- Short-Term
- WSFG Current: -5%
- F0%/NTZ' Bias: Price Below,
- WSFG Trend: Down.
MSFG Month Jul
- Intermediate-Term
- MSFG Current: 43%
- F0%/NTZ' Bias: Price Above,
- MSFG Trend: Up.
YSFG Year 2026
- Long-Term
- YSFG Current: -47%
- F0%/NTZ' Bias: Price Below,
- YSFG Trend: Down.
Swing Pivots
- (Short-Term) 1. Pvt. Trend: DTrend,
- (Intermediate-Term) 2. HiLo Trend: DTrend,
- 3. Pvt. Evolve: Pvt Low 1512.5,
- 4. Pvt. Next: Pvt High 1947.5,
- 5. Levels R: 5671.0, 5036.5, 2498.5,
- 6. Levels S: 1512.5.
Weekly Benchmarks
- (Short-Term) 5 Day: 1691.5 Up Trend,
- (Short-Term) 10 Day: 1871.5 Down Trend,
- (Intermediate-Term) 20 Day: 2026.5 Down Trend,
- (Intermediate-Term) 55 Day: 2587 Down Trend,
- (Long-Term) 100 Day: 2976.5 Down Trend,
- (Long-Term) 200 Day: 2889.5 Down Trend.
Recent Trade Signals
- 14 Jul 2026: Short ETH 07-26 @ 1786.5 Signals.USAR-WSFG
- 13 Jul 2026: Short ETH 07-26 @ 1785 Signals.USAR.TR120
Overall Rating
- Short-Term: Bearish,
- Intermediate-Term: Neutral,
- Long-Term: Bearish.
Key Insights Summary
ETH futures are in a pronounced weekly down swing, with price trading below the weekly WSFG midpoint and the yearly NTZ bias still firmly below fair value. The pivot structure remains negative, with the active swing evolving off a lower pivot sequence and the next opposing pivot flagged above at 1947.5, while higher resistance layers sit at 2498.5, 5036.5, and 5671.0. Weekly price action shows a strong impulsive selloff from the 2026 peak area into the 1500s, followed by only a modest rebound, which keeps the tape heavy and trend-led. The benchmark stack is still broadly bearish, as the medium and long benchmarks remain sloping lower and price is beneath most of them, even though July’s monthly grid is holding above its midpoint and has a constructive intermediate bias. Overall, the chart reflects a downtrend dominant long-term structure with a countertrend monthly bounce phase inside a larger bearish weekly cycle.
Chart Analysis ATS AI Generated: 2026-07-14 07:03 for Informational use only, not trading advice. Terms and Risk Disclosure Copyright © 2026. Algo Trading Systems LLC.