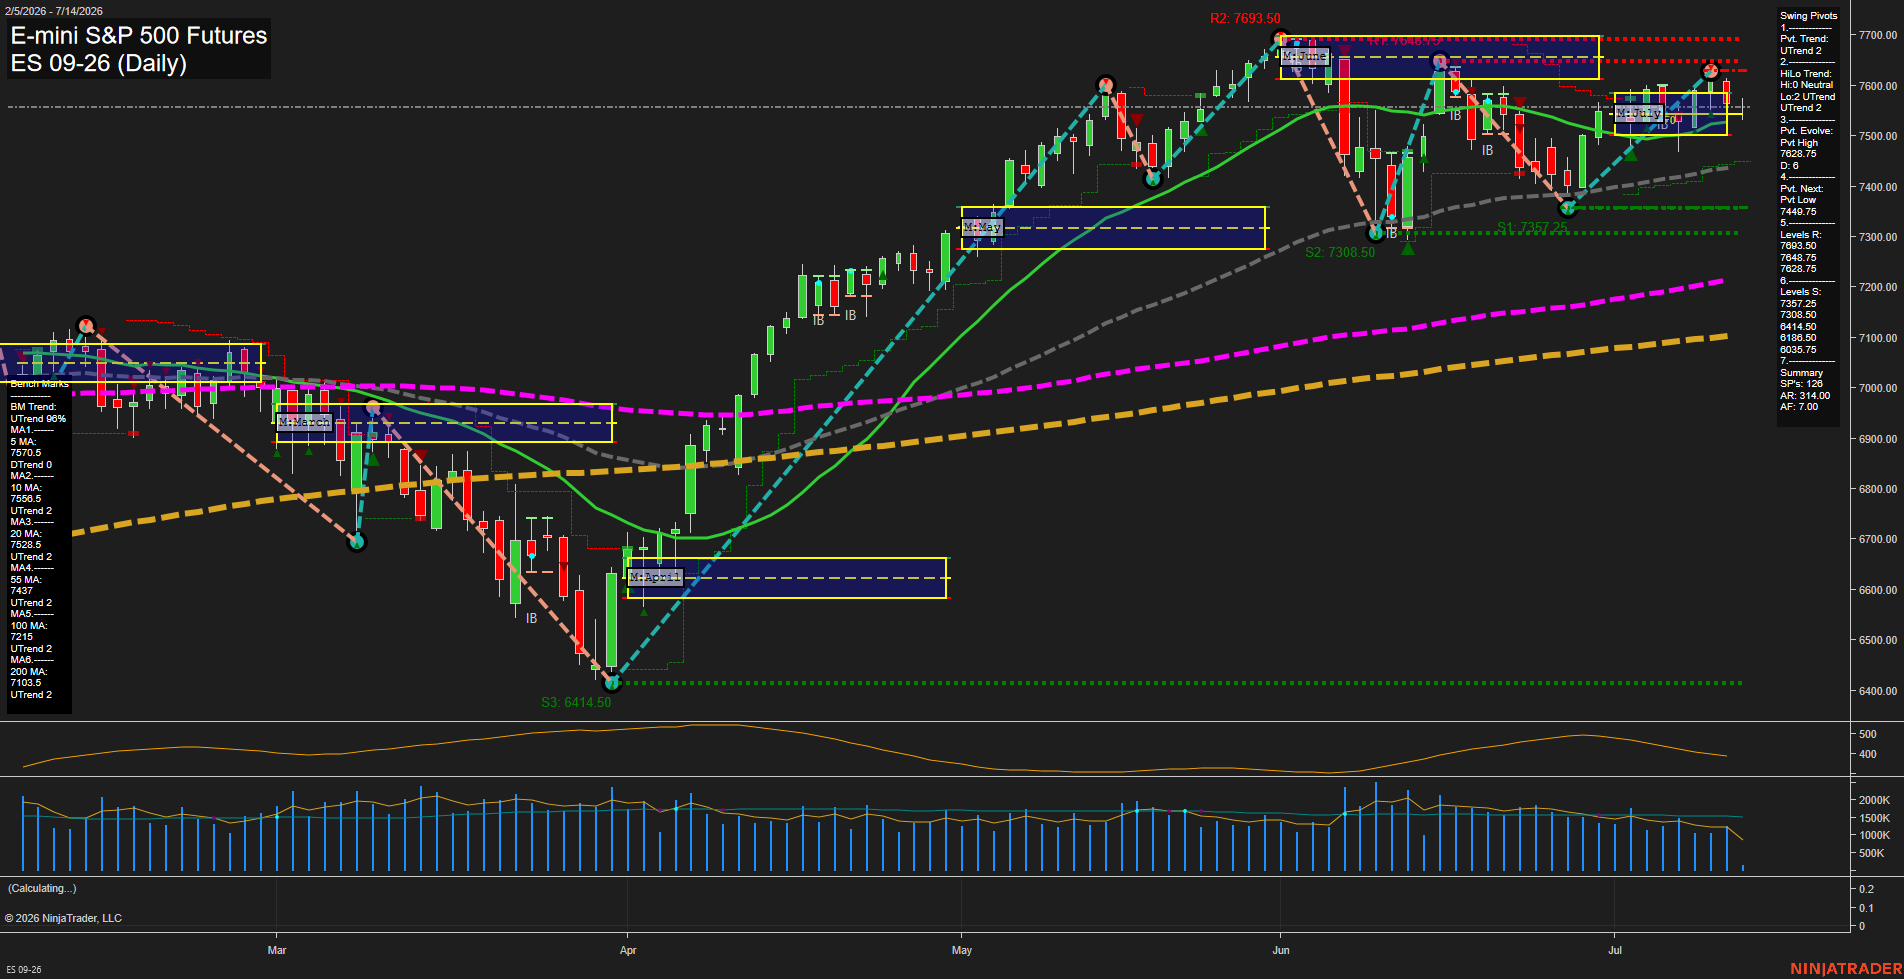
ES E-mini S&P 500 Futures Daily Chart Analysis: 2026-Jul-14 07:02 CT
Price Action
- Last: 7618.50,
- Bars: Medium,
- Mom: average.
WSFG Weekly
- Short-Term
- WSFG Current: -26%
- F0%/NTZ' Bias: Price Below,
- WSFG Trend: Down.
MSFG Month Jul
- Intermediate-Term
- MSFG Current: 5%
- F0%/NTZ' Bias: Price Above,
- MSFG Trend: Up.
YSFG Year 2026
- Long-Term
- YSFG Current: 45%
- F0%/NTZ' Bias: Price Above,
- YSFG Trend: Up.
Swing Pivots
- (Short-Term) 1. Pvt. Trend: UTrend,
- (Intermediate-Term) 2. HiLo Trend: UTrend,
- 3. Pvt. Evolve: Pvt High 7628.75,
- 4. Pvt. Next: Pvt Low 7449.75,
- 5. Levels R: 7693.50, 7648.75, 7628.75,
- 6. Levels S: 7357.25, 7308.50, 6414.50.
Daily Benchmarks
- (Short-Term) 5 Day: 7570.5 Down Trend,
- (Short-Term) 10 Day: 7556.5 Up Trend,
- (Intermediate-Term) 20 Day: 7528.5 Up Trend,
- (Intermediate-Term) 55 Day: 7437 Up Trend,
- (Long-Term) 100 Day: 7215 Up Trend,
- (Long-Term) 200 Day: 7103.5 Up Trend.
Additional Metrics
- ATR: 314.00,
- VOLMA: 1611996.
Recent Trade Signals
- 13 Jul 2026: Short ES 09-26 @ 7557 Signals.USAR.TR120
- 13 Jul 2026: Long ES 09-26 @ 7587.75 Signals.USAR-MSFG
- 13 Jul 2026: Short ES 09-26 @ 7577.25 Signals.USAR-WSFG
Overall Rating
- Short-Term: Bullish,
- Intermediate-Term: Bullish,
- Long-Term: Bullish.
Key Insights Summary
Price is holding above the 20-, 55-, 100-, and 200-day benchmarks, keeping the broader structure firmly constructive, while the short-term swing state remains in UTrend with the most recent pivot sequence still pointing higher. The chart has transitioned from the spring selloff into a strong summer recovery, followed by a consolidation just below the recent pivot high near 7628.75 and the upper resistance band around 7648.75 to 7693.50. Weekly fib positioning is still below its NTZ midpoint, which reflects a softer weekly posture versus the monthly and yearly grids that remain positive. Recent inside-bar and rejection behavior around the June highs shows a market digesting gains after a steep rally, with price action currently balancing between breakout continuation and range rotation near overhead resistance.
Chart Analysis ATS AI Generated: 2026-07-14 07:03 for Informational use only, not trading advice. Terms and Risk Disclosure Copyright © 2026. Algo Trading Systems LLC.