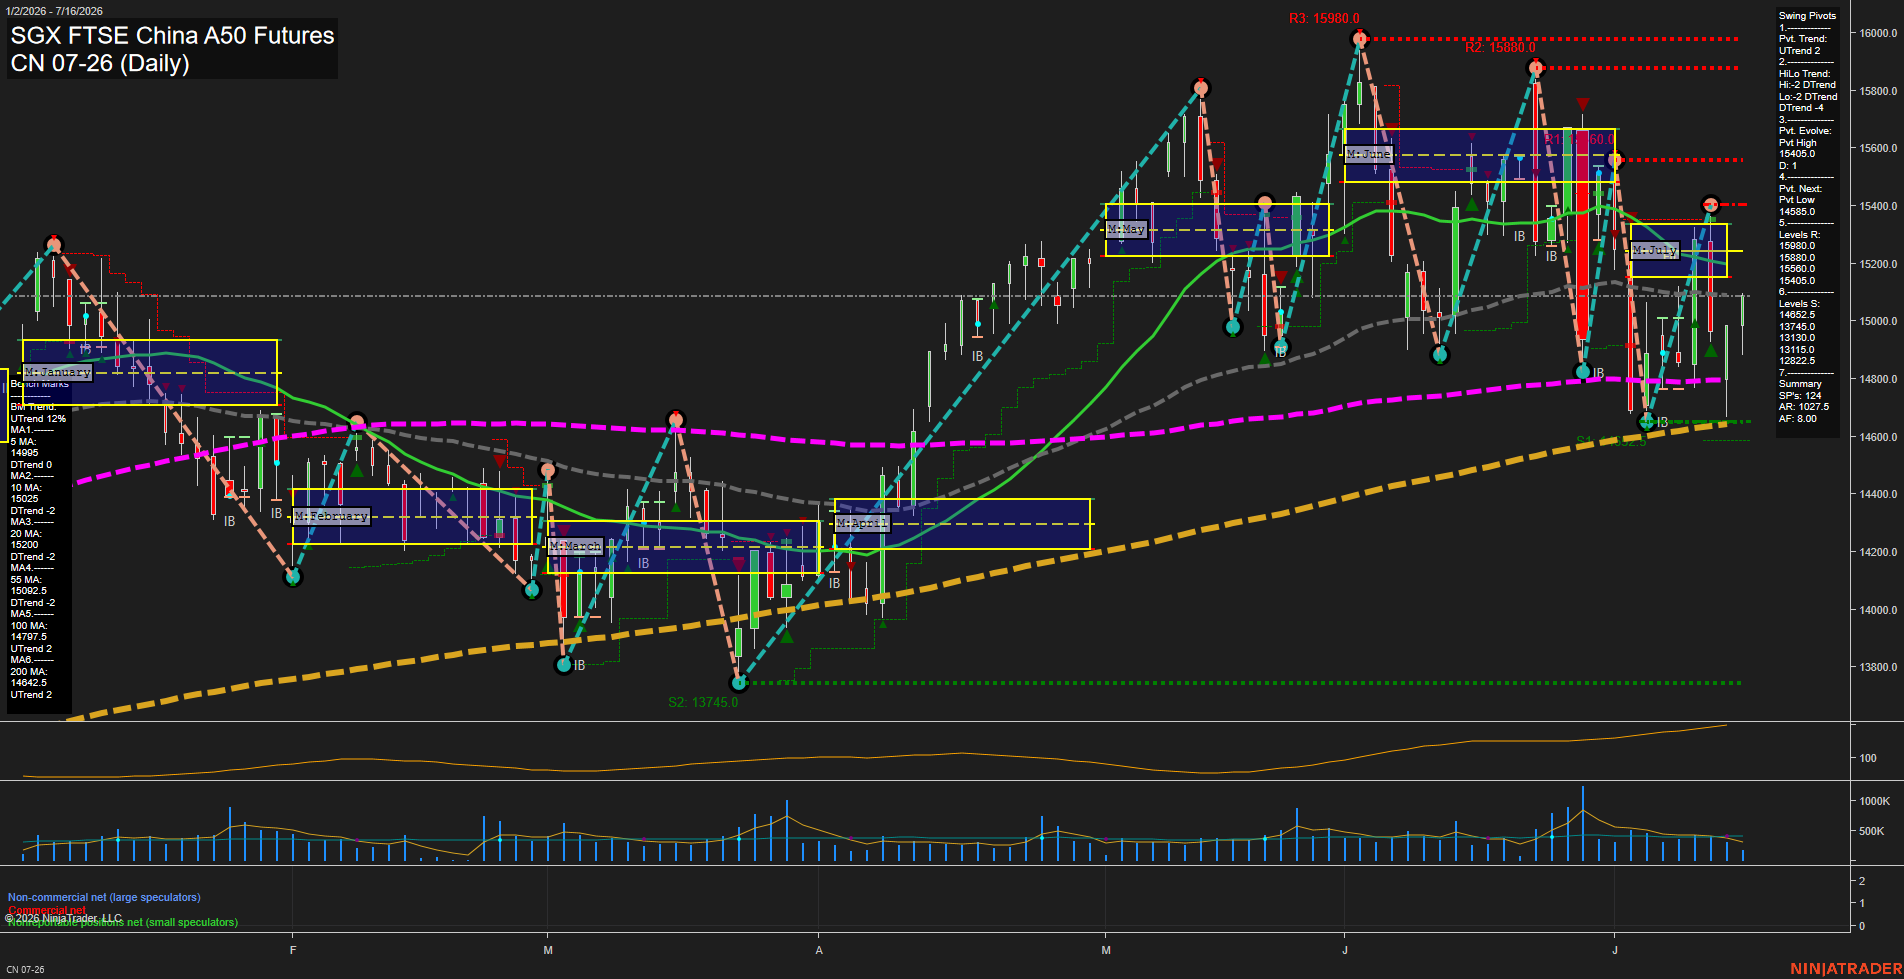
CN SGX FTSE China A50 Futures Daily Chart Analysis: 2026-Jul-14 07:02 CT
Price Action
- Last: 15050,
- Bars: Large,
- Mom: fast.
WSFG Weekly
- Short-Term
- WSFG Current: NA%
- F0%/NTZ' Bias: Price Neutral,
- WSFG Trend: Neutral.
MSFG Month Jul
- Intermediate-Term
- MSFG Current: NA%
- F0%/NTZ' Bias: Price Neutral,
- MSFG Trend: Neutral.
YSFG Year 2026
- Long-Term
- YSFG Current: NA%
- F0%/NTZ' Bias: Price Neutral,
- YSFG Trend: Neutral.
Swing Pivots
- (Short-Term) 1. Pvt. Trend: UTrend,
- (Intermediate-Term) 2. HiLo Trend: DTrend,
- 3. Pvt. Evolve: Pvt High 15405.0,
- 4. Pvt. Next: Pvt Low 14685.0,
- 5. Levels R: 15980.0, 15880.0, 15600.0, 15405.0,
- 6. Levels S: 14865.2, 13745.0, 13313.0, 13115.0, 12822.5.
Daily Benchmarks
- (Short-Term) 5 Day: 14995 Up Trend,
- (Short-Term) 10 Day: 15025 Down Trend,
- (Intermediate-Term) 20 Day: 15200 Down Trend,
- (Intermediate-Term) 55 Day: 15092.5 Down Trend,
- (Long-Term) 100 Day: 14797.5 Up Trend,
- (Long-Term) 200 Day: 14642.5 Up Trend.
Additional Metrics
- ATR: 87.5,
- VOLMA: 261842.
Overall Rating
- Short-Term: Neutral,
- Intermediate-Term: Neutral,
- Long-Term: Bullish.
Key Insights Summary
Price is trading in a mixed swing structure with a strong long-term base from the rising 100-day and 200-day benchmarks, while the shorter benchmark stack remains conflicted and the intermediate swing trend is still leaning down. The pivot map shows the short-term pivot trend holding UTrend, but the HiLo structure remains DTrend, which reflects a market that has recovered from prior selloffs yet still has overhead resistance from the 15405, 15600, 15880, and 15980 swing levels. The current location near the 15050 area places price inside a broad consolidation zone beneath the 20-day and 55-day averages, while staying above the long-term support shelf around the 14797 to 14642 region. The overall pattern reads as a choppy rotational phase with sharp rally-and-retrace swings, frequent inside-bar behavior, and repeated tests of the monthly NTZ zones, leaving the broader tone neutral-to-firm over the long horizon and still range-bound in the nearer term.
Chart Analysis ATS AI Generated: 2026-07-14 07:02 for Informational use only, not trading advice. Terms and Risk Disclosure Copyright © 2026. Algo Trading Systems LLC.