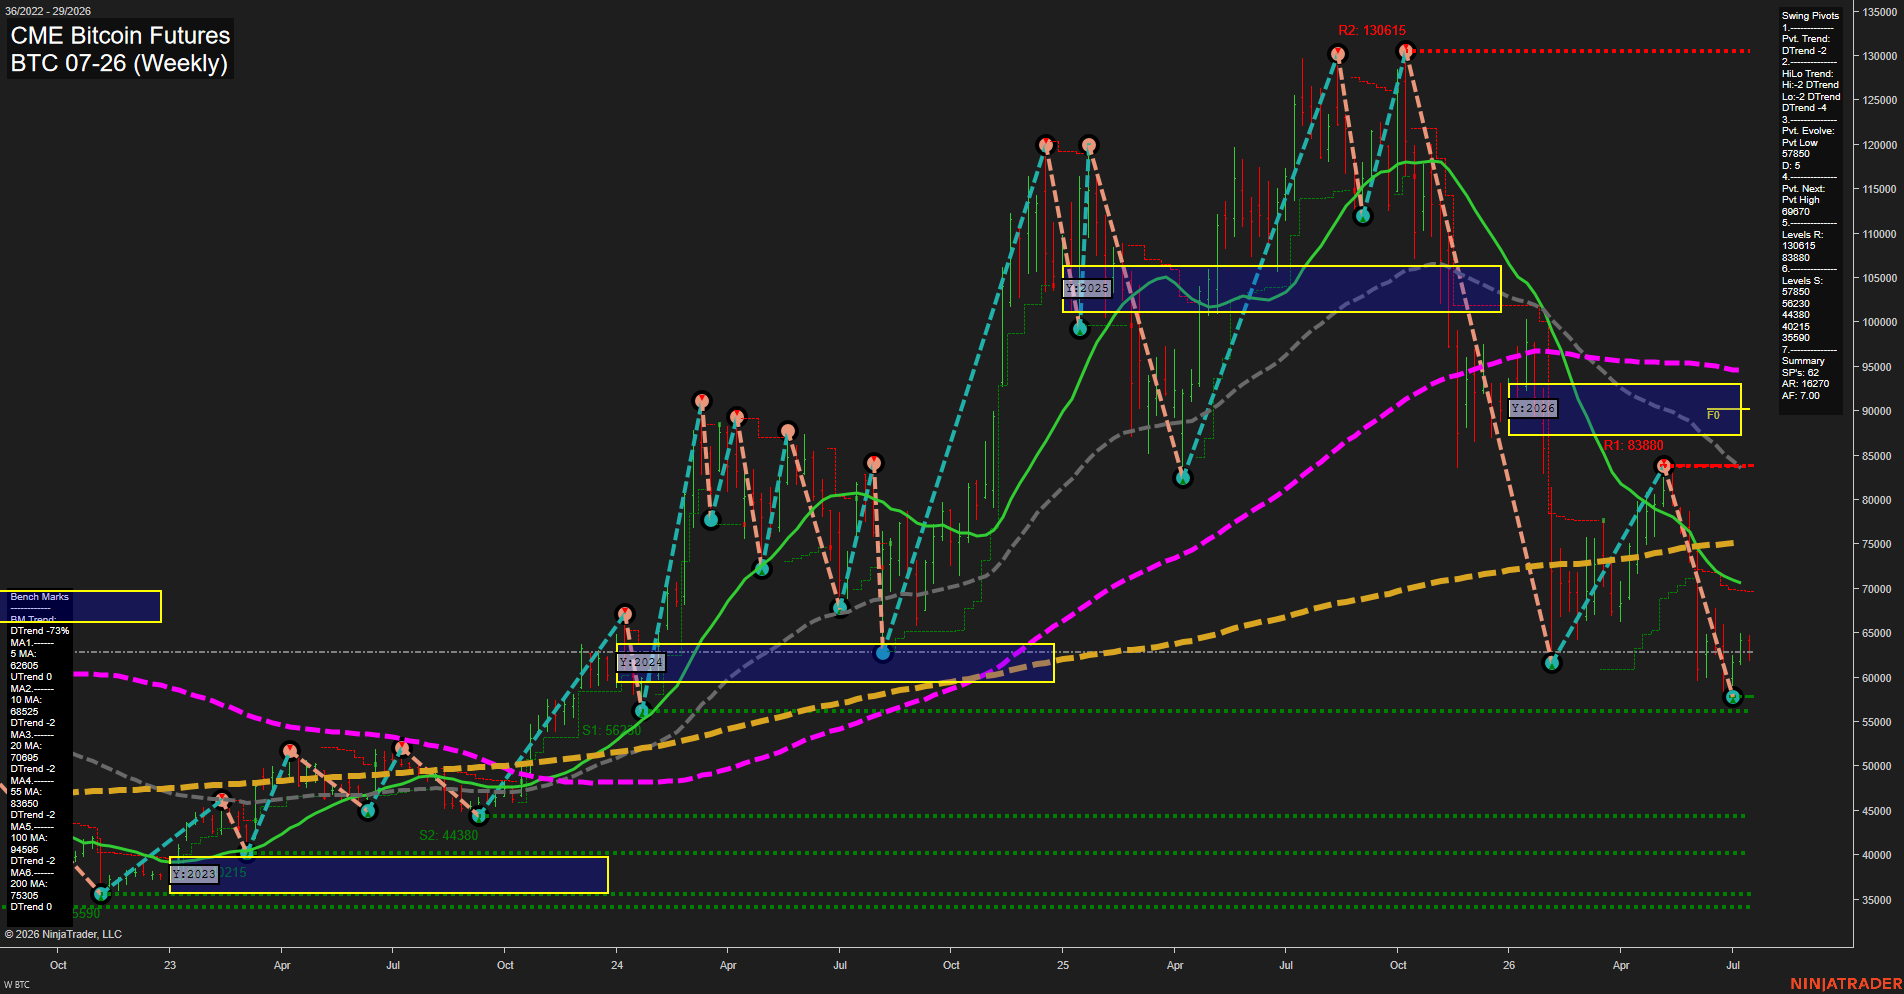
BTC CME Bitcoin Futures Weekly Chart Analysis: 2026-Jul-14 07:01 CT
Price Action
- Last: 62800,
- Bars: Large,
- Mom: fast.
WSFG Weekly
- Short-Term
- WSFG Current: -21%
- F0%/NTZ' Bias: Price Below,
- WSFG Trend: Down.
MSFG Month Jul
- Intermediate-Term
- MSFG Current: 28%
- F0%/NTZ' Bias: Price Above,
- MSFG Trend: Up.
YSFG Year 2026
- Long-Term
- YSFG Current: -95%
- F0%/NTZ' Bias: Price Below,
- YSFG Trend: Down.
Swing Pivots
- (Short-Term) 1. Pvt. Trend: DTrend,
- (Intermediate-Term) 2. HiLo Trend: DTrend,
- 3. Pvt. Evolve: Pvt Low 57850,
- 4. Pvt. Next: Pvt High 69870,
- 5. Levels R: 130615, 83880,
- 6. Levels S: 57850, 56230, 44380, 40215, 35590.
Weekly Benchmarks
- (Short-Term) 5 Day: 62805 Up Trend,
- (Short-Term) 10 Day: 68525 Down Trend,
- (Intermediate-Term) 20 Day: 70695 Down Trend,
- (Intermediate-Term) 55 Day: 83860 Down Trend,
- (Long-Term) 100 Day: 94595 Down Trend,
- (Long-Term) 200 Day: 75305 Down Trend.
Recent Trade Signals
- 13 Jul 2026: Short BTC 07-26 @ 63545 Signals.USAR-WSFG
- 10 Jul 2026: Long BTC 07-26 @ 63960 Signals.USAR.TR120
- 07 Jul 2026: Long BTC 07-26 @ 64110 Signals.USAR.TR720
Overall Rating
- Short-Term: Bearish,
- Intermediate-Term: Neutral,
- Long-Term: Bearish.
Key Insights Summary
BTC futures are in a sharp weekly downside phase after failing from the 2026 peak zone and breaking back below the yearly fib midline. The short-term structure is firmly DTrend, with price trading under the weekly NTZ and the recent short signal confirming downside momentum. Intermediate-term still shows a month-level bullish bias, but that strength is weakening as price rolls over beneath the 10, 20, 55, and 100-day benchmarks. Long-term remains bearish with the yearly session deeply negative and the market holding well below the major trend benchmarks. The pivot map shows the last confirmed low at 57,850 and the next upside pivot only above 69,870, leaving price in a lower-range recovery attempt rather than a trend reversal. The broader profile is a selloff into support, followed by choppy rebound behavior and renewed pressure, with 83,880 now acting as a major overhead resistance zone.
Chart Analysis ATS AI Generated: 2026-07-14 07:01 for Informational use only, not trading advice. Terms and Risk Disclosure Copyright © 2026. Algo Trading Systems LLC.