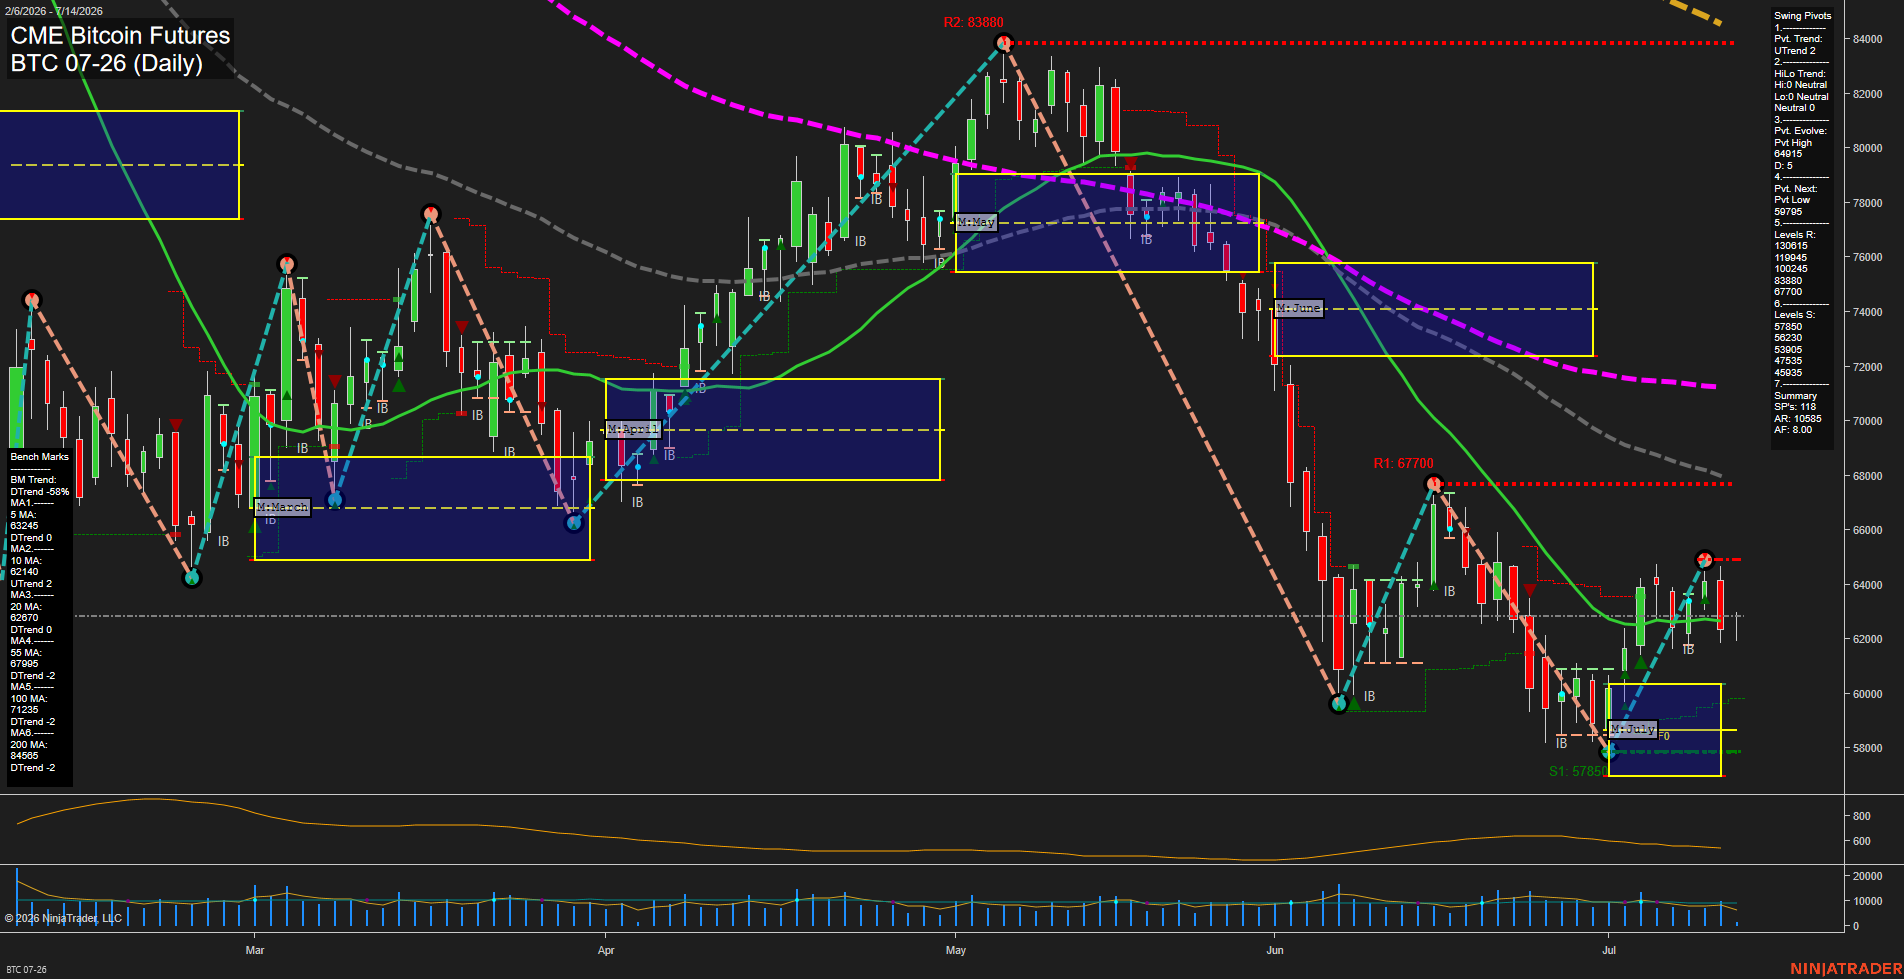
BTC CME Bitcoin Futures Daily Chart Analysis: 2026-Jul-14 07:01 CT
Price Action
- Last: 62800,
- Bars: Large,
- Mom: Fast.
WSFG Weekly
- Short-Term
- WSFG Current: -21%
- F0%/NTZ' Bias: Price Below,
- WSFG Trend: Down.
MSFG Month Jul
- Intermediate-Term
- MSFG Current: 28%
- F0%/NTZ' Bias: Price Above,
- MSFG Trend: Up.
YSFG Year 2026
- Long-Term
- YSFG Current: -95%
- F0%/NTZ' Bias: Price Below,
- YSFG Trend: Down.
Swing Pivots
- (Short-Term) 1. Pvt. Trend: UTrend,
- (Intermediate-Term) 2. HiLo Trend: DTrend,
- 3. Pvt. Evolve: Pvt High 64915,
- 4. Pvt. Next: Pvt Low 59795,
- 5. Levels R: 130615, 119945, 100245, 83880, 67700,
- 6. Levels S: 57850, 56230, 53905, 47535, 45935.
Daily Benchmarks
- (Short-Term) 5 Day: 63245 Down Trend,
- (Short-Term) 10 Day: 62140 Up Trend,
- (Intermediate-Term) 20 Day: 62670 Up Trend,
- (Intermediate-Term) 55 Day: 67995 Down Trend,
- (Long-Term) 100 Day: 71235 Down Trend,
- (Long-Term) 200 Day: 84585 Down Trend.
Additional Metrics
Recent Trade Signals
- 13 Jul 2026: Short BTC 07-26 @ 63545 Signals.USAR-WSFG
- 10 Jul 2026: Long BTC 07-26 @ 63960 Signals.USAR.TR120
- 07 Jul 2026: Long BTC 07-26 @ 64110 Signals.USAR.TR720
Overall Rating
- Short-Term: Bearish,
- Intermediate-Term: Bearish,
- Long-Term: Bearish.
Key Insights Summary
BTC CME daily structure remains in a sharp corrective downswing after the May peak, with price pressing below the 5-day and holding only marginally above the 10-day and 20-day benchmarks. The weekly session grid stays below F0% and trends down, reinforcing short-term weakness, while the monthly July grid is still positive above F0% and carries an upward bias from the larger mid-cycle rebound. Swing pivots show the short-term pivot trend still up from the most recent rebound, but the higher-timeframe hi/lo structure has rolled over and the next pivot focus is a lower low setup near 59795. Resistance is stacked overhead at 67700 and above, while the support ladder clusters near 57850 and lower. The tape is volatile and directional, with large candles and fast momentum showing selloff persistence after the failed rally from the 67k area, leaving the chart in a bearish retracement phase with lower highs dominating the recent sequence.
Chart Analysis ATS AI Generated: 2026-07-14 07:01 for Informational use only, not trading advice. Terms and Risk Disclosure Copyright © 2026. Algo Trading Systems LLC.