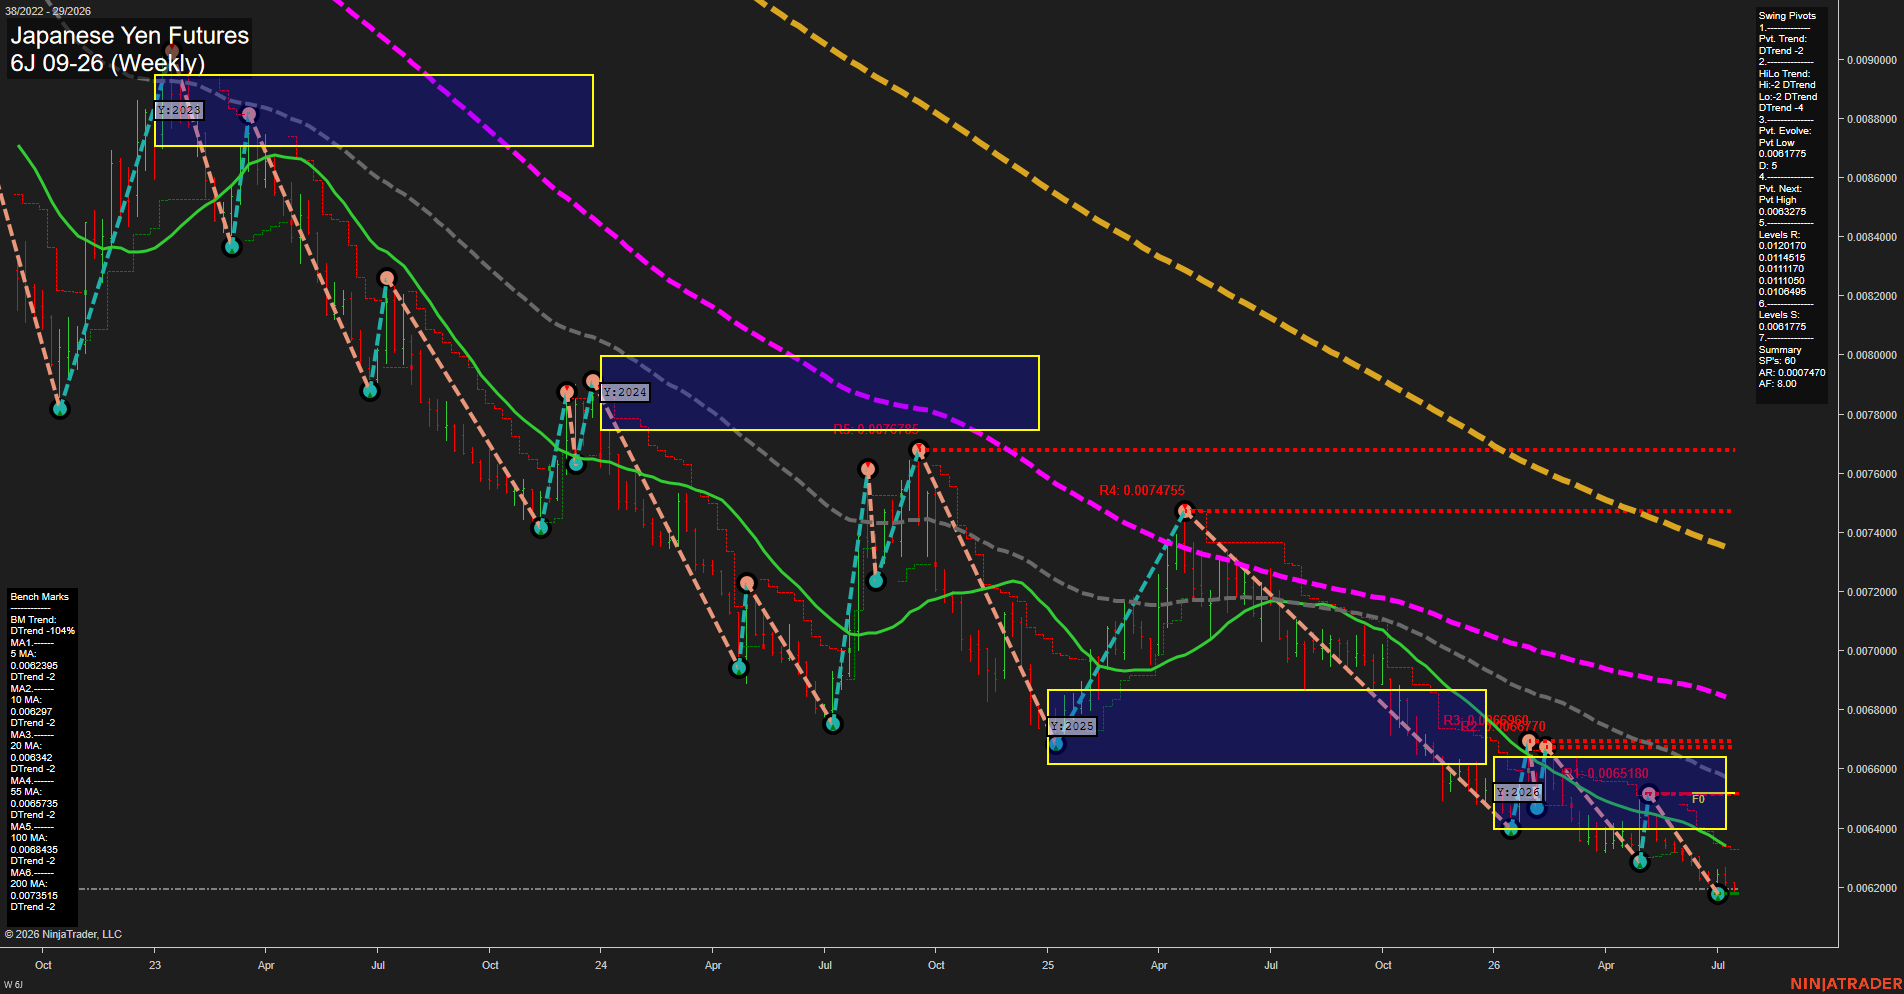
6J Japanese Yen Futures Weekly Chart Analysis: 2026-Jul-14 07:01 CT
Price Action
- Last: 0.006180,
- Bars: Small,
- Mom: slow.
WSFG Weekly
- Short-Term
- WSFG Current: -29%
- F0%/NTZ' Bias: Price Below,
- WSFG Trend: Down.
MSFG Month Jul
- Intermediate-Term
- MSFG Current: 10%
- F0%/NTZ' Bias: Price Above,
- MSFG Trend: Up.
YSFG Year 2026
- Long-Term
- YSFG Current: -26%
- F0%/NTZ' Bias: Price Below,
- YSFG Trend: Down.
Swing Pivots
- (Short-Term) 1. Pvt. Trend: DTrend,
- (Intermediate-Term) 2. HiLo Trend: DTrend,
- 3. Pvt. Evolve: Pvt Low 0.0061775,
- 4. Pvt. Next: Pvt High 0.0063275,
- 5. Levels R: 0.0120170, 0.0114515, 0.0111170, 0.0110150, 0.0106495,
- 6. Levels S: 0.0061777.
Weekly Benchmarks
- (Short-Term) 5 Day: 0.0062395 Down Trend,
- (Short-Term) 10 Day: 0.0060297 Down Trend,
- (Intermediate-Term) 20 Day: 0.0063420 Down Trend,
- (Intermediate-Term) 55 Day: 0.0066753 Down Trend,
- (Long-Term) 100 Day: 0.0068435 Down Trend,
- (Long-Term) 200 Day: 0.0073515 Down Trend.
Recent Trade Signals
- 13 Jul 2026: Short 6J 09-26 @ 0.006194 Signals.USAR.TR120
- 13 Jul 2026: Long 6J 09-26 @ 0.006208 Signals.USAR-MSFG
Overall Rating
- Short-Term: Bearish,
- Intermediate-Term: Neutral,
- Long-Term: Bearish.
Key Insights Summary
Weekly price action remains compressed near the cycle low with small bars and slow momentum, reflecting a mature downtrend rather than an expansion phase. The short-term structure is bearish with WSFG below F0% and the pivot trend still in DTrend, while price is pressing against the lower band of the yearly session framework. The monthly grid is the only constructive element, with price above its F0% zone and MSFG showing an up bias, but that strength has not yet been confirmed by the moving-average stack or the broader pivot structure. All benchmark averages are aligned downward and price is trading below the 20, 55, 100, and 200-week style reference levels, reinforcing the dominant bearish long-term backdrop. The recent signal mix shows a short and a long entry clustered tightly around the 0.00619 to 0.00621 area, matching the chart’s late-stage compression and failed rebound attempts. Overall, the chart reads as a persistent downtrend with intermittent countertrend monthly lift, lower highs, and repeated tests of support near the 2026 low zone.
Chart Analysis ATS AI Generated: 2026-07-14 07:01 for Informational use only, not trading advice. Terms and Risk Disclosure Copyright © 2026. Algo Trading Systems LLC.