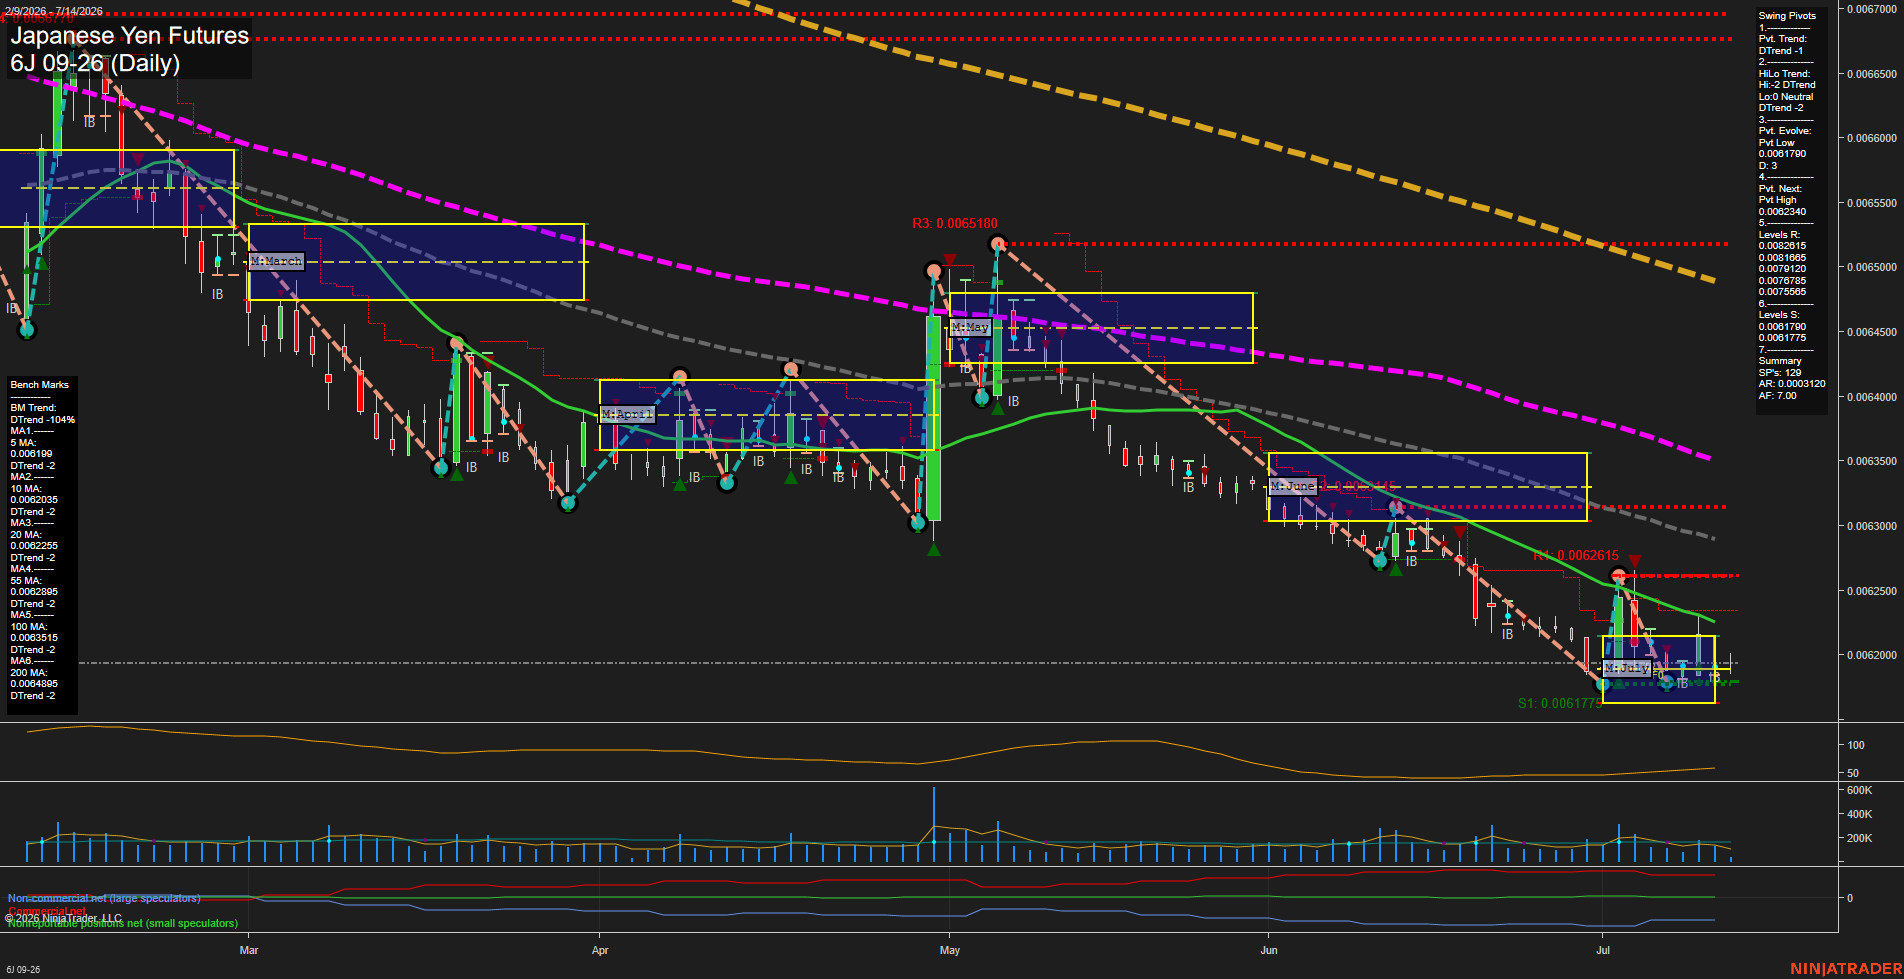
6J Japanese Yen Futures Daily Chart Analysis: 2026-Jul-14 07:01 CT
Price Action
- Last: 0.006185,
- Bars: Small,
- Mom: slow.
WSFG Weekly
- Short-Term
- WSFG Current: -29%
- F0%/NTZ' Bias: Price Below,
- WSFG Trend: Down.
MSFG Month Jul
- Intermediate-Term
- MSFG Current: 10%
- F0%/NTZ' Bias: Price Above,
- MSFG Trend: Up.
YSFG Year 2026
- Long-Term
- YSFG Current: -26%
- F0%/NTZ' Bias: Price Below,
- YSFG Trend: Down.
Swing Pivots
- (Short-Term) 1. Pvt. Trend: DTrend,
- (Intermediate-Term) 2. HiLo Trend: DTrend,
- 3. Pvt. Evolve: Pvt Low 0.0061790,
- 4. Pvt. Next: Pvt High 0.0062340,
- 5. Levels R: 0.0062615, 0.0061865, 0.00617920, 0.00617785, 0.00617565,
- 6. Levels S: 0.00617790, 0.00617775, 0.00617750, 0.00617580, 0.00617565.
Daily Benchmarks
- (Short-Term) 5 Day: 0.006190 Down Trend,
- (Short-Term) 10 Day: 0.0062035 Down Trend,
- (Intermediate-Term) 20 Day: 0.0062255 Down Trend,
- (Intermediate-Term) 55 Day: 0.0062895 Down Trend,
- (Long-Term) 100 Day: 0.0063515 Down Trend,
- (Long-Term) 200 Day: 0.0064895 Down Trend.
Additional Metrics
Recent Trade Signals
- 13 Jul 2026: Short 6J 09-26 @ 0.006194 Signals.USAR.TR120
- 13 Jul 2026: Long 6J 09-26 @ 0.006208 Signals.USAR-MSFG
Overall Rating
- Short-Term: Bearish,
- Intermediate-Term: Bullish,
- Long-Term: Bearish.
Key Insights Summary
The chart is trading in a persistent downtrend structure with a series of lower highs and lower lows, while the latest price action is compressing near the lower end of the recent July range. Short-term swing pivots remain bearish and price is below the weekly fib bias, matching the weaker daily benchmark stack where all visible moving averages are trending down. In contrast, the monthly fib grid still shows price above the July midpoint bias, reflecting an intermediate-term rebound phase inside a broader bearish daily and yearly structure. The current setup is choppy to consolidative after the sharp late-June selloff and early-July rebound, with recent candles showing narrow bars and reduced momentum versus prior impulse swings. The dominant theme is a bearish long-term tape with a brief countertrend monthly recovery that has not yet fully reversed the daily trend.
Chart Analysis ATS AI Generated: 2026-07-14 07:01 for Informational use only, not trading advice. Terms and Risk Disclosure Copyright © 2026. Algo Trading Systems LLC.