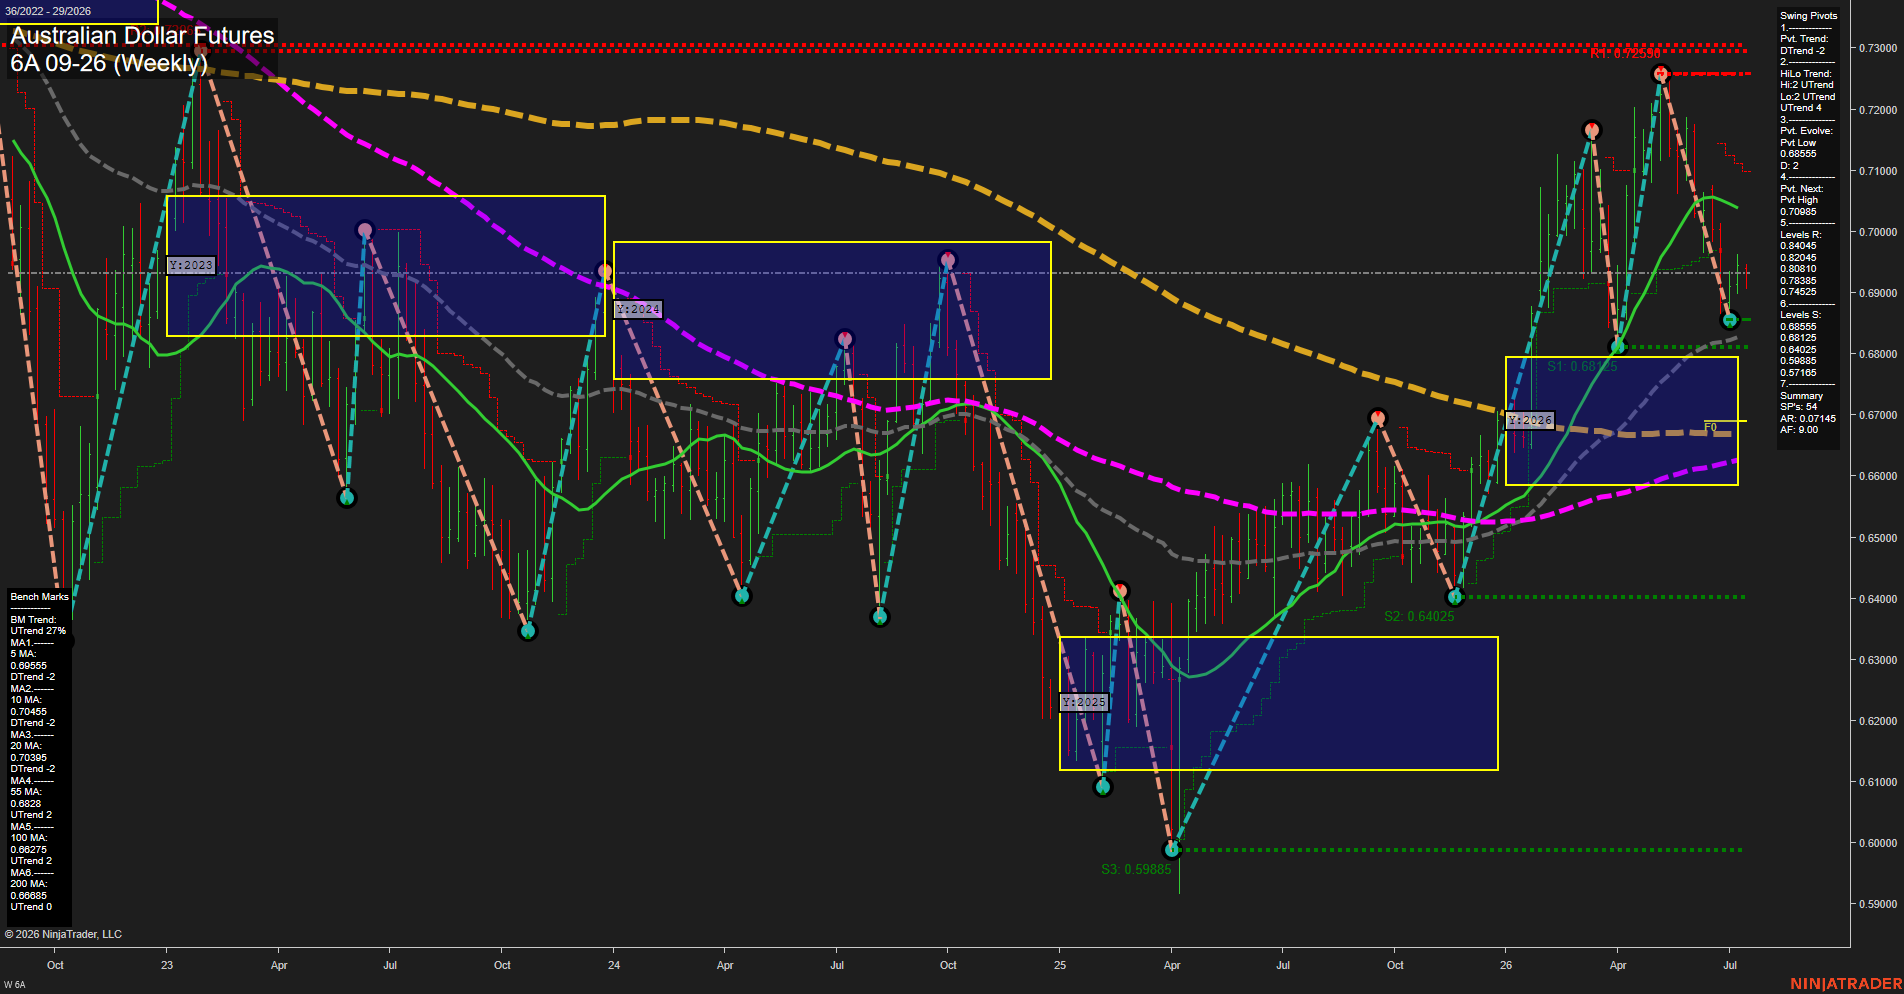
6A Australian Dollar Futures Weekly Chart Analysis: 2026-Jul-14 07:00 CT
Price Action
- Last: 0.6855,
- Bars: Large,
- Mom: fast.
WSFG Weekly
- Short-Term
- WSFG Current: NA%
- F0%/NTZ' Bias: Price Neutral,
- WSFG Trend: Neutral.
MSFG Month Jul
- Intermediate-Term
- MSFG Current: NA%
- F0%/NTZ' Bias: Price Neutral,
- MSFG Trend: Neutral.
YSFG Year 2026
- Long-Term
- YSFG Current: NA%
- F0%/NTZ' Bias: Price Neutral,
- YSFG Trend: Neutral.
Swing Pivots
- (Short-Term) 1. Pvt. Trend: DTrend,
- (Intermediate-Term) 2. HiLo Trend: UTrend,
- 3. Pvt. Evolve: Pvt Low 0.68555,
- 4. Pvt. Next: Pvt High 0.70985,
- 5. Levels R: 0.84045, 0.82045, 0.80810, 0.78385, 0.74525,
- 6. Levels S: 0.68555, 0.68125, 0.64025, 0.59885, 0.57165.
Weekly Benchmarks
- (Short-Term) 5 Day: 0.69555 Down Trend,
- (Short-Term) 10 Day: 0.70455 Down Trend,
- (Intermediate-Term) 20 Day: 0.70395 Down Trend,
- (Intermediate-Term) 55 Day: 0.68280 Up Trend,
- (Long-Term) 100 Day: 0.66275 Up Trend,
- (Long-Term) 200 Day: 0.66885 Up Trend.
Recent Trade Signals
- 14 Jul 2026: Long 6A 09-26 @ 0.69445 Signals.USAR-MSFG
- 14 Jul 2026: Short 6A 09-26 @ 0.69215 Signals.USAR-WSFG
- 13 Jul 2026: Short 6A 09-26 @ 0.6914 Signals.USAR.TR120
Overall Rating
- Short-Term: Bearish,
- Intermediate-Term: Neutral,
- Long-Term: Neutral.
Key Insights Summary
The weekly chart shows a strong impulse off the 2025 low into the 2026 high, followed by a sharp retracement from the upper pivot zone near 0.70985. Price is now back in the lower half of the 2026 yearly range and sitting just above the 0.68555 swing support, with the short-term pivot structure still in DTrend. The short and intermediate benchmark averages remain under pressure, while the 55-day and longer averages are still rising and provide a more constructive backdrop underneath. The yearly fib box remains centered on a neutral-to-balanced area, and the recent sequence of long and short signals reflects the transition from breakout expansion to consolidation and rotation. From a swing-trader perspective, the chart is showing a corrective phase after a rally, with mixed momentum and a market that is still working through the 0.68 to 0.71 range.
Chart Analysis ATS AI Generated: 2026-07-14 07:00 for Informational use only, not trading advice. Terms and Risk Disclosure Copyright © 2026. Algo Trading Systems LLC.