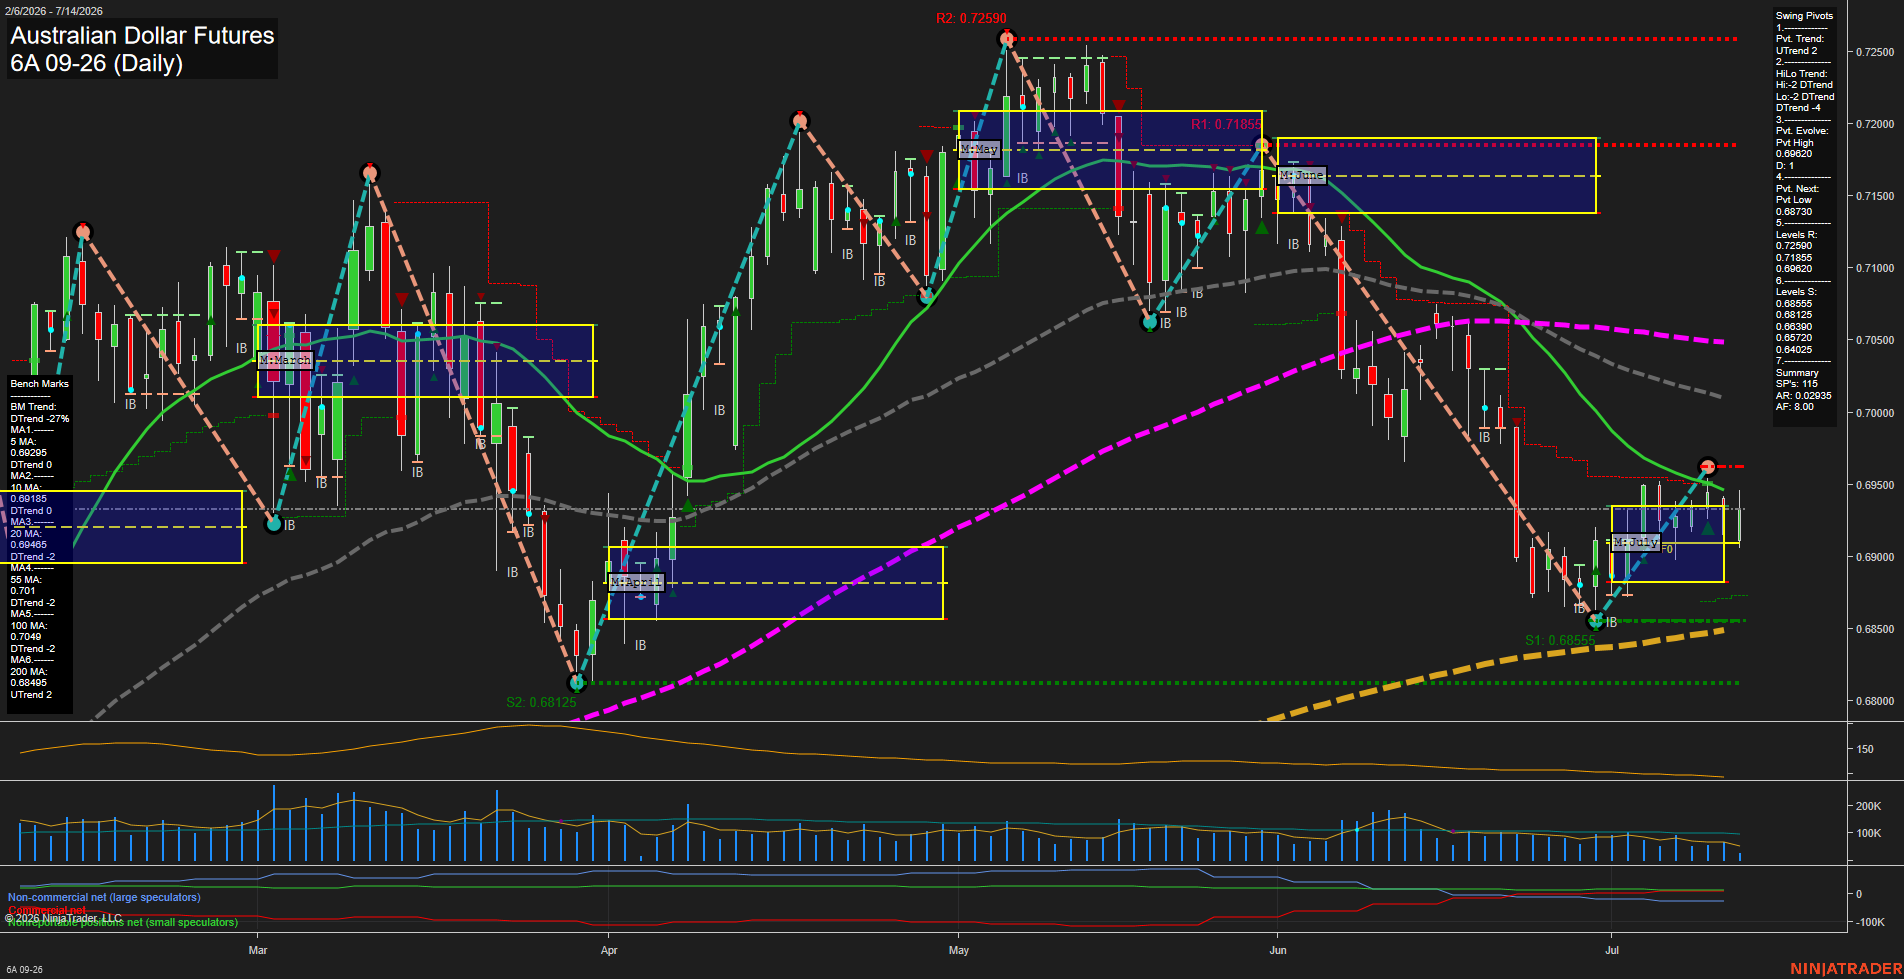
6A Australian Dollar Futures Daily Chart Analysis: 2026-Jul-14 07:00 CT
Price Action
- Last: 0.6942,
- Bars: Medium,
- Mom: Slow.
WSFG Weekly
- Short-Term
- WSFG Current: NA%
- F0%/NTZ' Bias: Price Neutral,
- WSFG Trend: Neutral.
MSFG Month Jul
- Intermediate-Term
- MSFG Current: NA%
- F0%/NTZ' Bias: Price Neutral,
- MSFG Trend: Neutral.
YSFG Year 2026
- Long-Term
- YSFG Current: NA%
- F0%/NTZ' Bias: Price Neutral,
- YSFG Trend: Neutral.
Swing Pivots
- (Short-Term) 1. Pvt. Trend: UTrend,
- (Intermediate-Term) 2. HiLo Trend: DTrend,
- 3. Pvt. Evolve: Pvt High 0.69620,
- 4. Pvt. Next: Pvt Low 0.68730,
- 5. Levels R: 0.72590, 0.71855, 0.69620,
- 6. Levels S: 0.68555, 0.68390, 0.68125, 0.65720, 0.64025.
Daily Benchmarks
- (Short-Term) 5 Day: 0.69295 Down Trend,
- (Short-Term) 10 Day: 0.69420 Down Trend,
- (Intermediate-Term) 20 Day: 0.69485 Down Trend,
- (Intermediate-Term) 55 Day: 0.70100 Down Trend,
- (Long-Term) 100 Day: 0.70490 Down Trend,
- (Long-Term) 200 Day: 0.68495 Up Trend.
Additional Metrics
Recent Trade Signals
- 14 Jul 2026: Long 6A 09-26 @ 0.69445 Signals.USAR-MSFG
- 14 Jul 2026: Short 6A 09-26 @ 0.69215 Signals.USAR-WSFG
- 13 Jul 2026: Short 6A 09-26 @ 0.6914 Signals.USAR.TR120
Overall Rating
- Short-Term: Bearish,
- Intermediate-Term: Bearish,
- Long-Term: Neutral.
Key Insights Summary
The daily structure shows a corrective rebound inside a broader down-sloping intermediate trend, with price trading near the short-term benchmark cluster and just under the declining 20, 55, and 100 day averages. The short-term pivot trend remains up, but the higher-timeframe HiLo trend is still down, keeping the chart in a mixed transition state rather than a clean trend reversal. Price is working above the lower July session zone and near the 0.6940 area, while nearby pivot resistance remains defined at 0.69620 and 0.71855, and layered support sits around 0.68555, 0.68390, and 0.68125. The recent signal sequence reflects that tension, with a short-term bearish WSFG/TR120 tone offset by a fresh MSFG long trigger, which is consistent with a choppy consolidation-and-retest phase rather than a one-direction impulse.
Chart Analysis ATS AI Generated: 2026-07-14 07:00 for Informational use only, not trading advice. Terms and Risk Disclosure Copyright © 2026. Algo Trading Systems LLC.