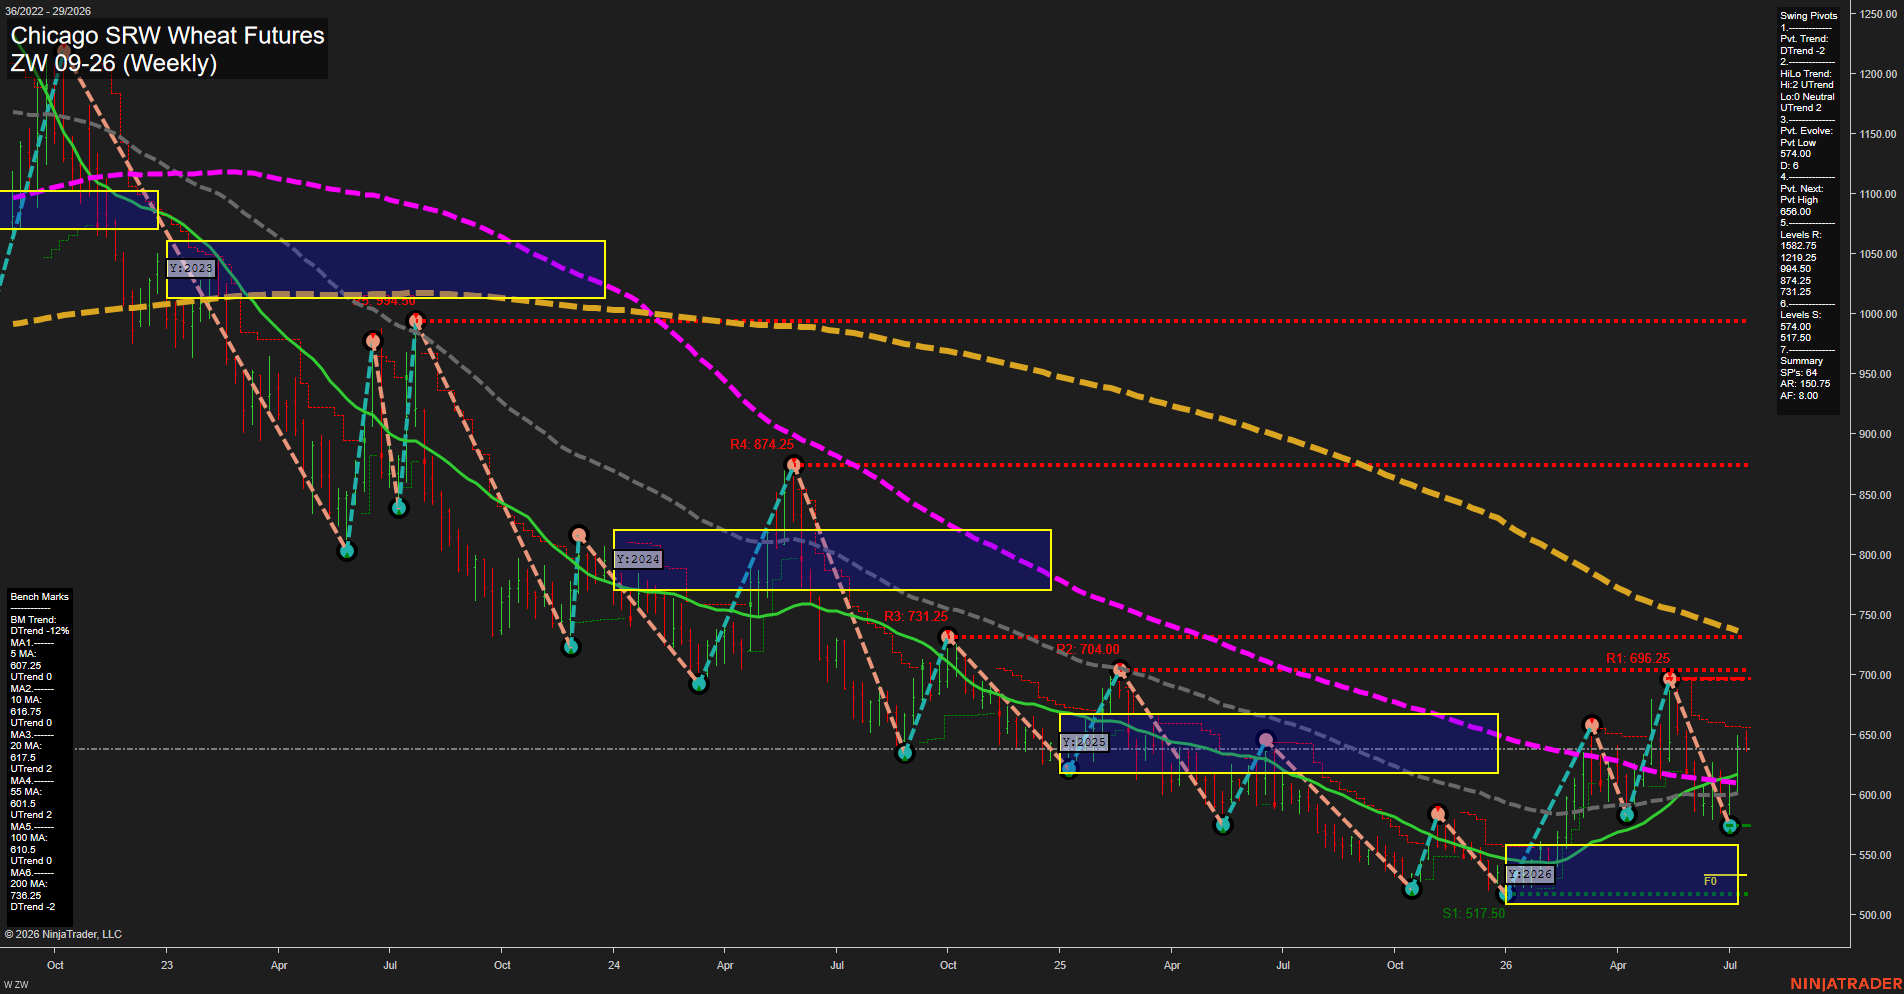
ZW Chicago SRW Wheat Futures Weekly Chart Analysis: 2026-Jul-13 07:09 CT
Price Action
- Last: 650.00,
- Bars: Medium,
- Mom: average.
WSFG Weekly
- Short-Term
- WSFG Current: -19%
- F0%/NTZ' Bias: Price Below,
- WSFG Trend: Down.
MSFG Month Jul
- Intermediate-Term
- MSFG Current: 58%
- F0%/NTZ' Bias: Price Above,
- MSFG Trend: Up.
YSFG Year 2026
- Long-Term
- YSFG Current: 43%
- F0%/NTZ' Bias: Price Above,
- YSFG Trend: Up.
Swing Pivots
- (Short-Term) 1. Pvt. Trend: DTrend,
- (Intermediate-Term) 2. HiLo Trend: UTrend,
- 3. Pvt. Evolve: Pvt Low 574.00,
- 4. Pvt. Next: Pvt High 656.00,
- 5. Levels R: 1582.75, 1219.25, 994.50, 874.25, 731.25,
- 6. Levels S: 574.00, 517.50.
Weekly Benchmarks
- (Short-Term) 5 Day: 607.25 Up Trend,
- (Short-Term) 10 Day: 616.75 Up Trend,
- (Intermediate-Term) 20 Day: 617.50 Up Trend,
- (Intermediate-Term) 55 Day: 601.50 Up Trend,
- (Long-Term) 100 Day: 610.50 Up Trend,
- (Long-Term) 200 Day: 736.25 Down Trend.
Recent Trade Signals
- 10 Jul 2026: Long ZW 09-26 @ 614.5 Signals.USAR-MSFG
- 07 Jul 2026: Long ZW 09-26 @ 614.75 Signals.USAR.TR720
- 06 Jul 2026: Long ZW 09-26 @ 604.5 Signals.USAR-WSFG
Overall Rating
- Short-Term: Bearish,
- Intermediate-Term: Bullish,
- Long-Term: Bullish.
Key Insights Summary
Wheat remains in a broad multi-year downtrend from the 2023-2024 highs, but the current weekly structure has shifted into a rebound phase from the 2026 low near 574, with price working above the 20, 55, and 100 week benchmarks. The short-term swing pivot remains DTrend, which keeps the near-term tone heavy even as the monthly and yearly session fib grids stay above their F0% centers and point upward. The latest action reflects a bounce and consolidation sequence after a sharp advance toward the 656 area, with price now easing back from the recent push. The pivot map still shows layered overhead resistance from prior swing highs, while support is anchored by 574 and then 517.50. Overall, the chart shows a mixed transition state: short-term corrective, intermediate-term constructive, and long-term recovering from a deep base.
Chart Analysis ATS AI Generated: 2026-07-13 07:10 for Informational use only, not trading advice. Terms and Risk Disclosure Copyright © 2026. Algo Trading Systems LLC.