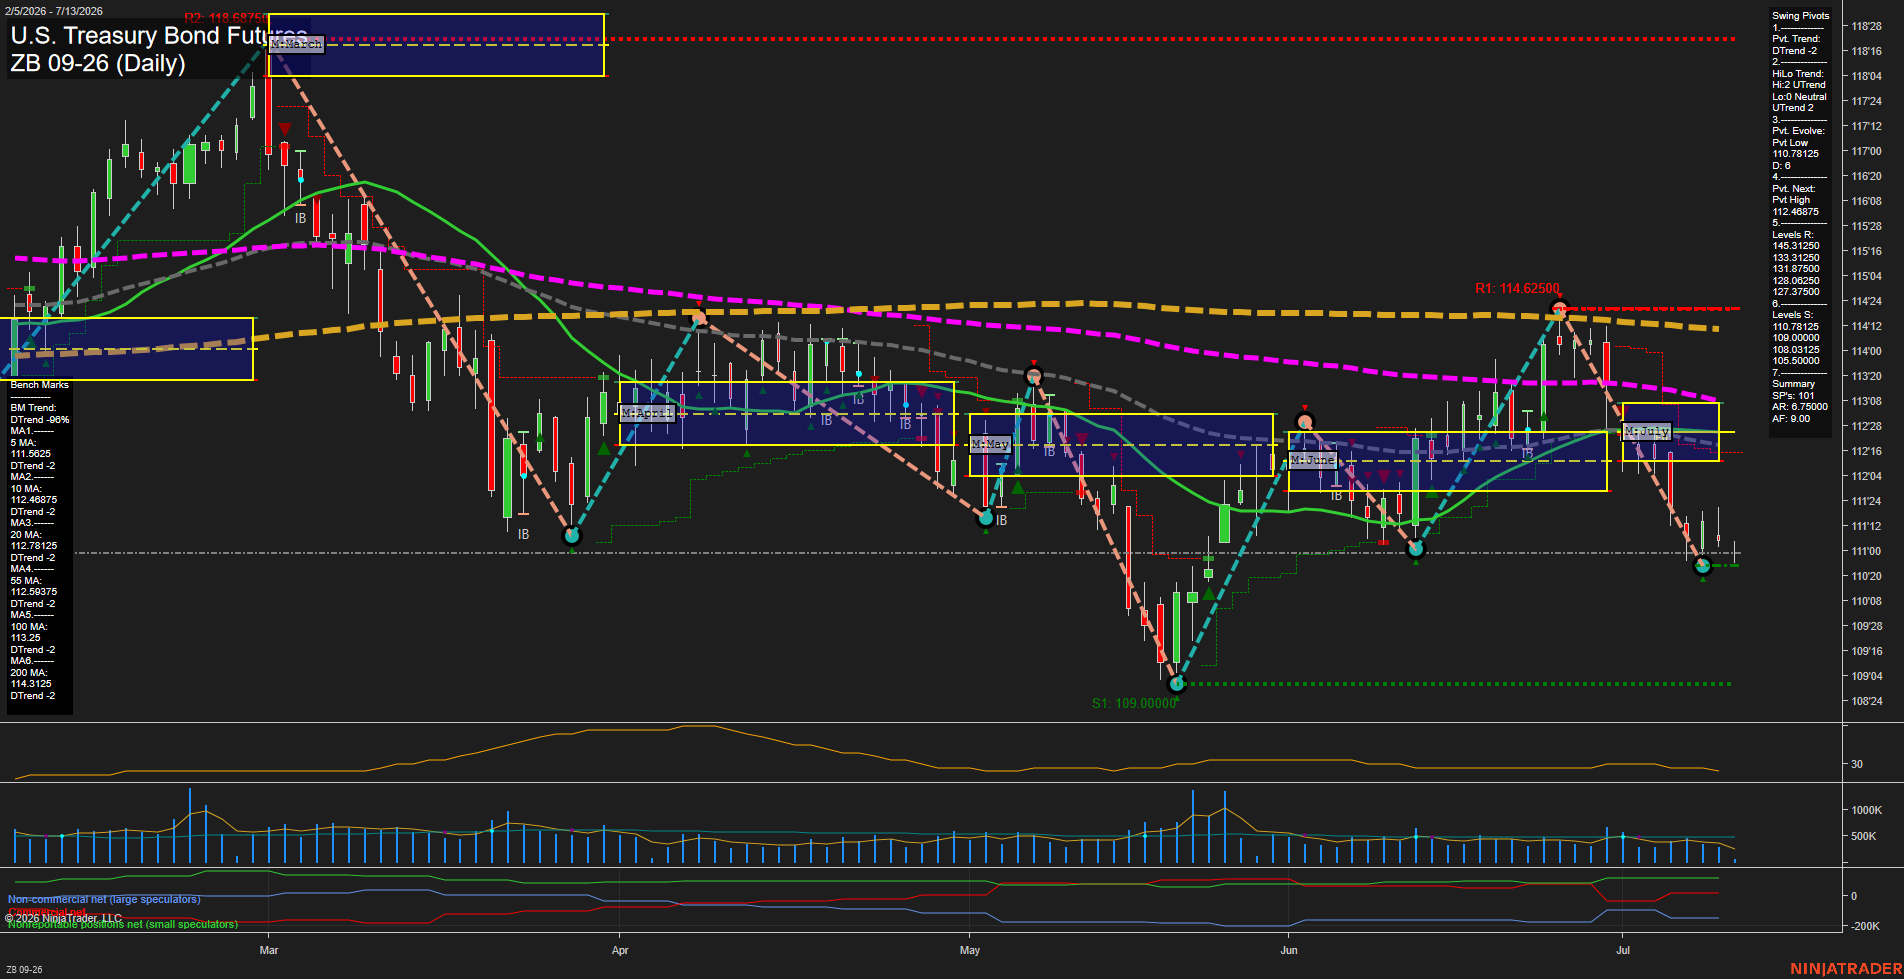
ZB U.S. Treasury Bond Futures Daily Chart Analysis: 2026-Jul-13 07:08 CT
Price Action
- Last: 111.00,
- Bars: Large,
- Mom: fast.
WSFG Weekly
- Short-Term
- WSFG Current: NA%
- F0%/NTZ' Bias: Price Neutral,
- WSFG Trend: Neutral.
MSFG Month Jul
- Intermediate-Term
- MSFG Current: NA%
- F0%/NTZ' Bias: Price Neutral,
- MSFG Trend: Neutral.
YSFG Year 2026
- Long-Term
- YSFG Current: NA%
- F0%/NTZ' Bias: Price Neutral,
- YSFG Trend: Neutral.
Swing Pivots
- (Short-Term) 1. Pvt. Trend: DTrend,
- (Intermediate-Term) 2. HiLo Trend: DTrend,
- 3. Pvt. Evolve: Pvt low 110.78125,
- 4. Pvt. Next: Pvt high 112.46875,
- 5. Levels R: 145.31250, 133.31250, 131.87500, 128.06250, 127.37500,
- 6. Levels S: 110.78125, 109.00000, 108.03125, 105.50000.
Daily Benchmarks
- (Short-Term) 5 Day: 111.5625 Down Trend,
- (Short-Term) 10 Day: 112.46875 Down Trend,
- (Intermediate-Term) 20 Day: 112.78125 Down Trend,
- (Intermediate-Term) 55 Day: 112.59375 Down Trend,
- (Long-Term) 100 Day: 113.25 Down Trend,
- (Long-Term) 200 Day: 114.3125 Down Trend.
Additional Metrics
Overall Rating
- Short-Term: Bearish,
- Intermediate-Term: Bearish,
- Long-Term: Bearish.
Key Insights Summary
The daily structure remains firmly downside-biased, with price trading below every benchmark moving average and the full MA stack still sloping lower. Swing pivots confirm a persistent DTrend, with the latest pivot low at 110.78125 defining the active downside structure and the next pivot high reference at 112.46875 marking the first meaningful rebound checkpoint. The chart shows repeated failed recovery attempts inside a broader descending sequence, including sharp selloffs followed by smaller countertrend bounces and inside-bar consolidation. Monthly and yearly session fib grids remain neutral in bias on the displayed summary, but they are sitting above current price action, reinforcing that the market is still operating under overhead supply. Volatility is elevated enough to keep daily ranges meaningful, while the recent price behavior reflects a bearish continuation phase rather than a completed reversal.
Chart Analysis ATS AI Generated: 2026-07-13 07:08 for Informational use only, not trading advice. Terms and Risk Disclosure Copyright © 2026. Algo Trading Systems LLC.