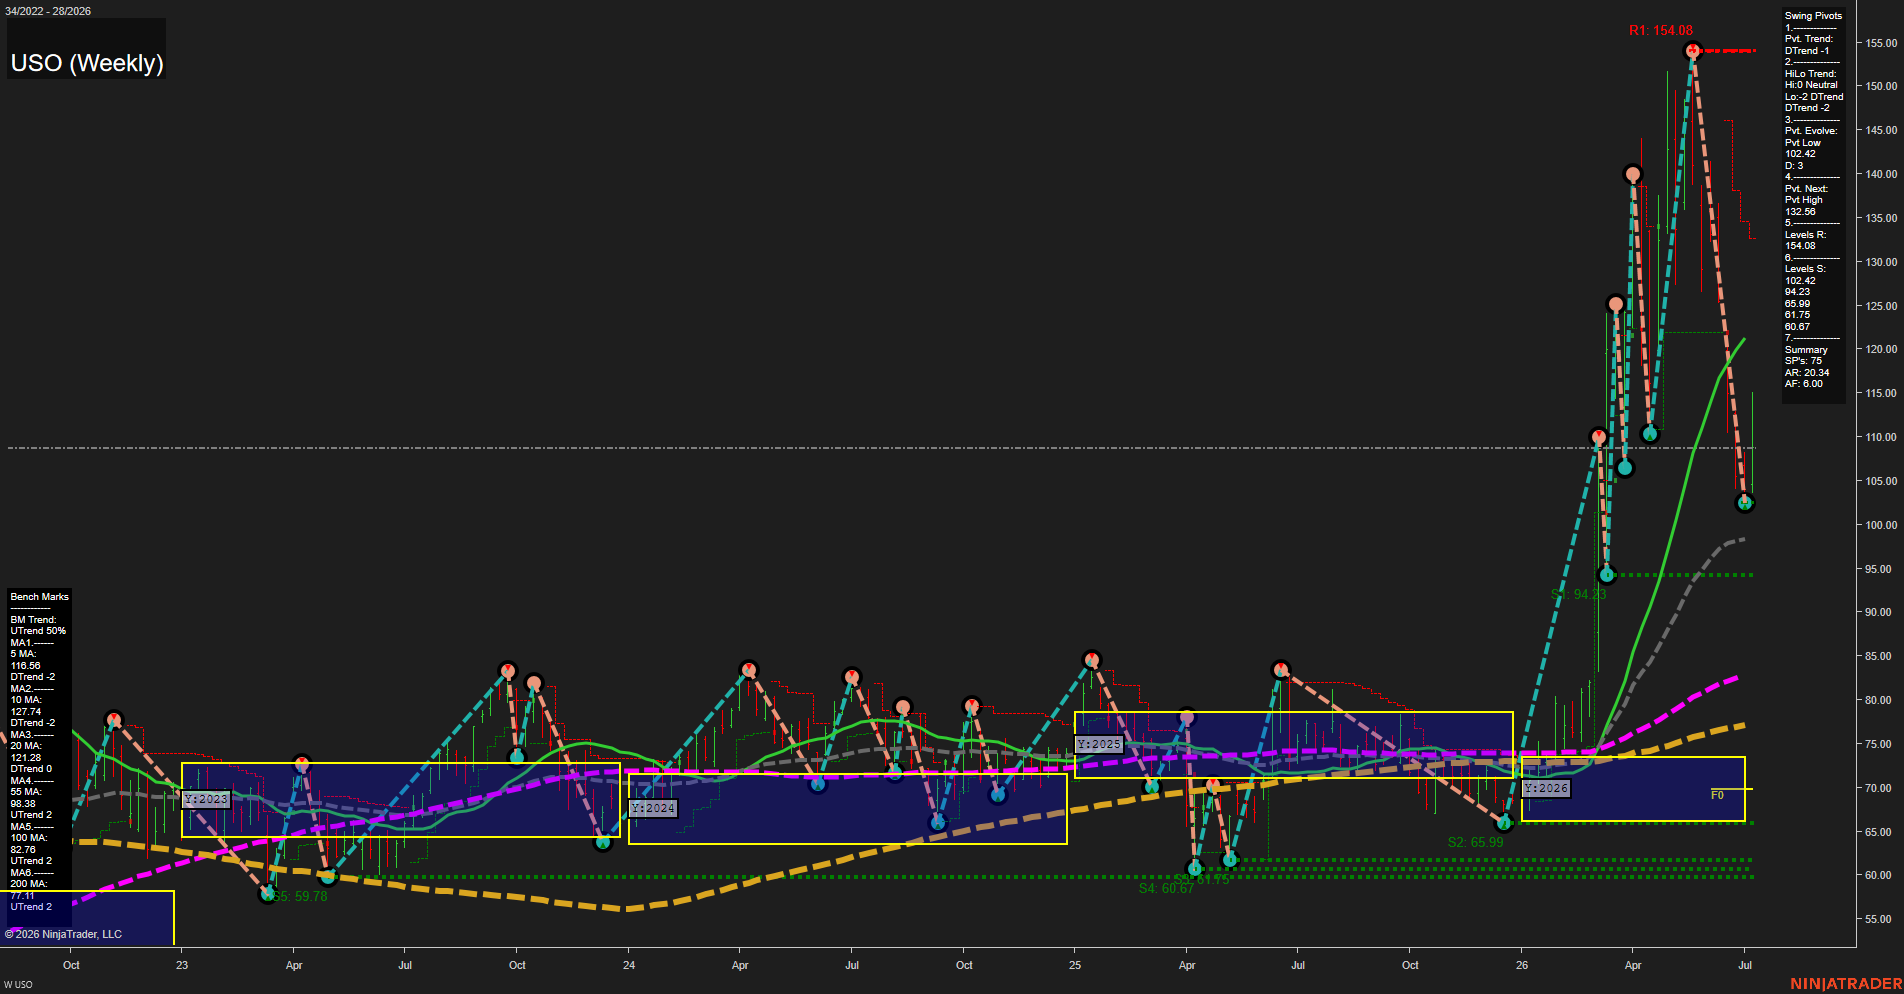
USO United States Oil Fund LP Weekly Chart Analysis: 2026-Jul-13 07:08 CT
Price Action
- Last: 102.42,
- Bars: Large,
- Mom: Fast.
WSFG Weekly
- Short-Term
- WSFG Current: NA%
- F0%/NTZ' Bias: Price Neutral,
- WSFG Trend: Neutral.
MSFG Month Jul
- Intermediate-Term
- MSFG Current: NA%
- F0%/NTZ' Bias: Price Neutral,
- MSFG Trend: Neutral.
YSFG Year 2026
- Long-Term
- YSFG Current: NA%
- F0%/NTZ' Bias: Price Neutral,
- YSFG Trend: Neutral.
Swing Pivots
- (Short-Term) 1. Pvt. Trend: DTrend,
- (Intermediate-Term) 2. HiLo Trend: DTrend,
- 3. Pvt. Evolve: Pvt Low 102.42,
- 4. Pvt. Next: Pvt High 132.58,
- 5. Levels R: 154.08,
- 6. Levels S: 102.42, 94.23, 65.99, 61.75, 60.67.
Weekly Benchmarks
- (Short-Term) 5 Day: 116.56 Down Trend,
- (Short-Term) 10 Day: 127.74 Down Trend,
- (Intermediate-Term) 20 Day: 121.28 Down Trend,
- (Intermediate-Term) 55 Day: 98.38 Up Trend,
- (Long-Term) 100 Day: 82.76 Up Trend,
- (Long-Term) 200 Day: 77.11 Up Trend.
Overall Rating
- Short-Term: Bearish,
- Intermediate-Term: Neutral,
- Long-Term: Bullish.
Key Insights Summary
USO is coming off a powerful weekly expansion move from the 90s into the 150s, followed by a sharp retracement back to the lower swing-pivot support area near 102.42. The short-term structure has rolled over, with the current pivot trend and HiLo trend both in DTrend and the faster benchmarks all pointing down. The weekly action is therefore corrective and volatile rather than stable trend continuation. Intermediate structure is mixed, with price back inside the yearly NTZ/F0 zone and the monthly/weekly fib grids showing a neutral balance after the prior breakout. Long-term structure remains constructive because the 55, 100, and 200 day benchmarks are still aligned higher, reflecting a broader uptrend underneath the pullback. The chart shows a recent impulse leg, a sharp rejection from the 154 area, and a fast retracement that has returned price to a major support cluster, making the weekly cycle look like a high-volatility trend reset after a strong rally.
Chart Analysis ATS AI Generated: 2026-07-13 07:08 for Informational use only, not trading advice. Terms and Risk Disclosure Copyright © 2026. Algo Trading Systems LLC.