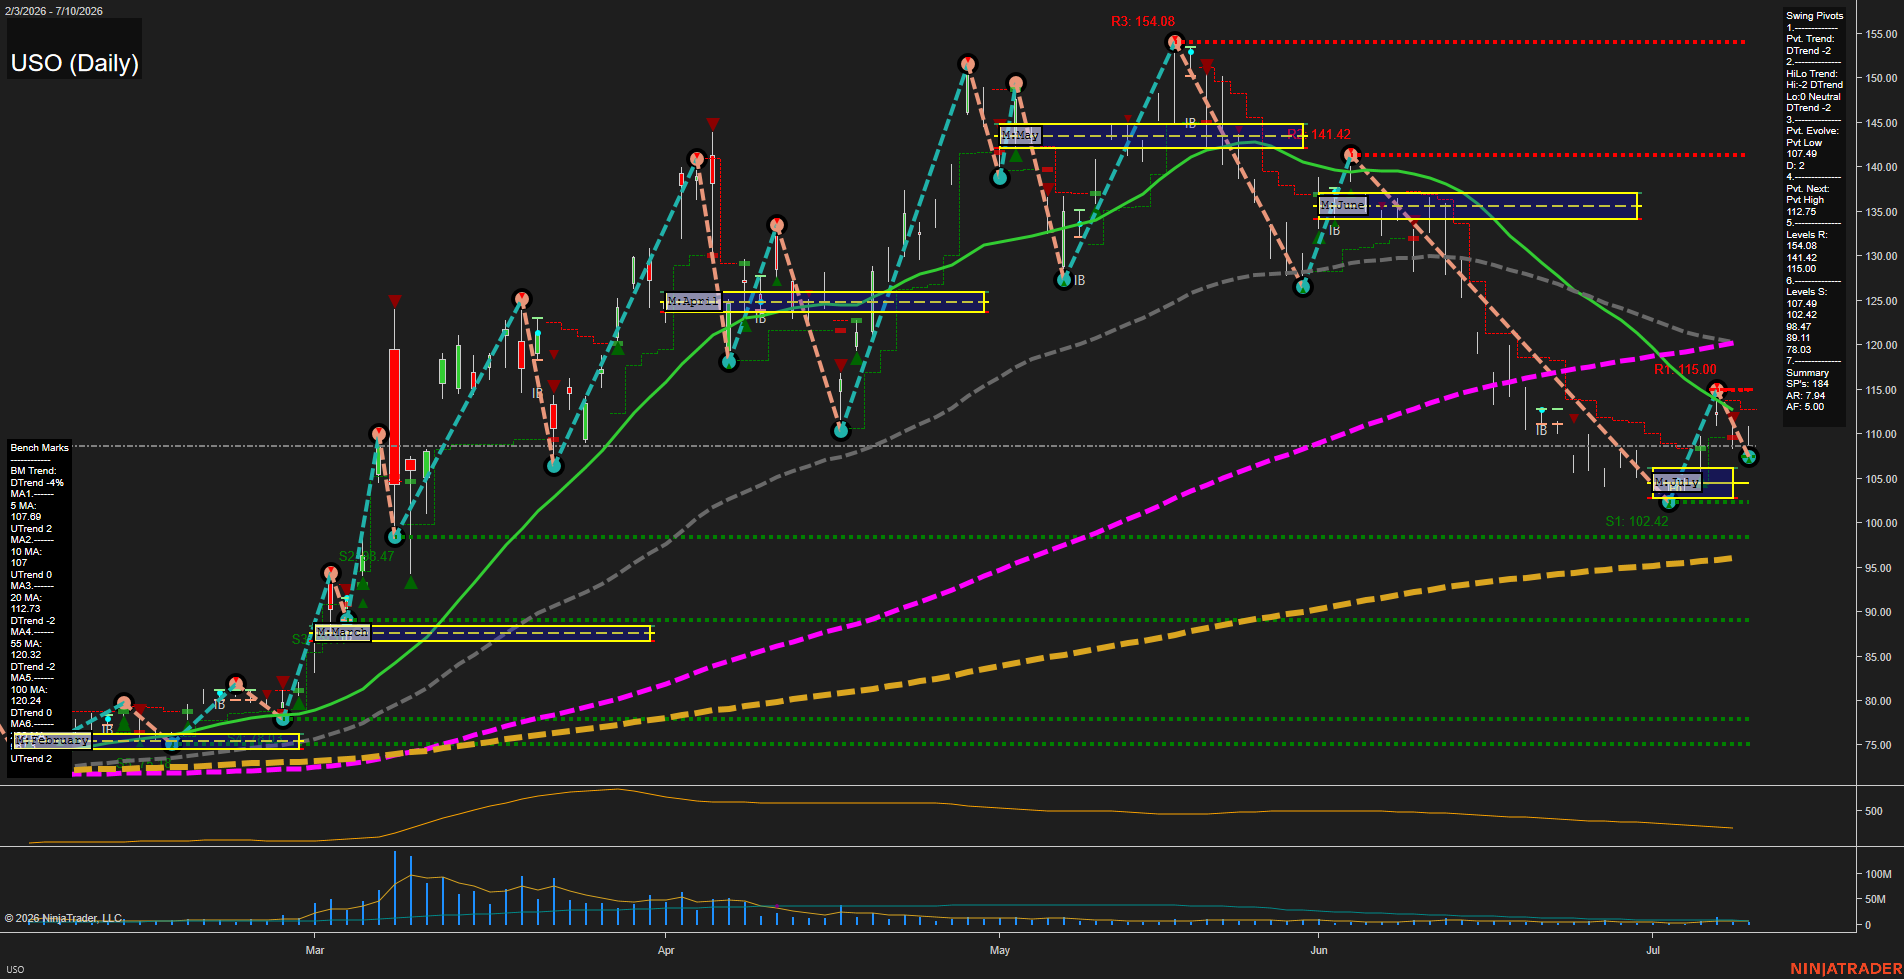
USO United States Oil Fund LP Daily Chart Analysis: 2026-Jul-13 07:08 CT
Price Action
- Last: 107.89,
- Bars: Large,
- Mom: fast.
WSFG Weekly
- Short-Term
- WSFG Current: NA%
- F0%/NTZ' Bias: Price Neutral,
- WSFG Trend: Neutral.
MSFG Month Jul
- Intermediate-Term
- MSFG Current: NA%
- F0%/NTZ' Bias: Price Neutral,
- MSFG Trend: Neutral.
YSFG Year 2026
- Long-Term
- YSFG Current: NA%
- F0%/NTZ' Bias: Price Neutral,
- YSFG Trend: Neutral.
Swing Pivots
- (Short-Term) 1. Pvt. Trend: DTrend,
- (Intermediate-Term) 2. HiLo Trend: DTrend,
- 3. Pvt. Evolve: Pvt Low 107.49,
- 4. Pvt. Next: Pvt High 112.75,
- 5. Levels R: 154.08, 141.42, 115.00,
- 6. Levels S: 107.49, 102.42, 98.47, 89.11, 78.03.
Daily Benchmarks
- (Short-Term) 5 Day: 107.69 Up Trend,
- (Short-Term) 10 Day: 107.00 Up Trend,
- (Intermediate-Term) 20 Day: 112.73 Down Trend,
- (Intermediate-Term) 55 Day: 120.32 Down Trend,
- (Long-Term) 100 Day: 100.24 Down Trend,
- (Long-Term) 200 Day: 74.03 Up Trend.
Additional Metrics
- ATR: 138,
- VOLMA: 2577640.
Overall Rating
- Short-Term: Bearish,
- Intermediate-Term: Bearish,
- Long-Term: Bullish.
Key Insights Summary
USO is in a sharp daily downswing off the early-June peak, with price pressing back toward the lower swing-pivot support zone after a fast selloff and a series of lower highs and lower lows. The short-term structure is still negative because the pivot trend and HiLo trend remain in DTrend, while price sits under the declining 20-day and 55-day benchmarks. The 5-day and 10-day averages are holding nearby, reflecting a near-term countertrend bounce inside a larger pullback. Monthly fib structure remains neutral on the chart, with no confirmed month-session directional edge shown, while the long-term picture is steadier because the 100-day is nearby and the 200-day benchmark remains structurally supportive. The current setup looks like a correction from an extended rally, with momentum strong but still working through retracement levels and prior support/rejection zones rather than a clean trend continuation.
Chart Analysis ATS AI Generated: 2026-07-13 07:08 for Informational use only, not trading advice. Terms and Risk Disclosure Copyright © 2026. Algo Trading Systems LLC.