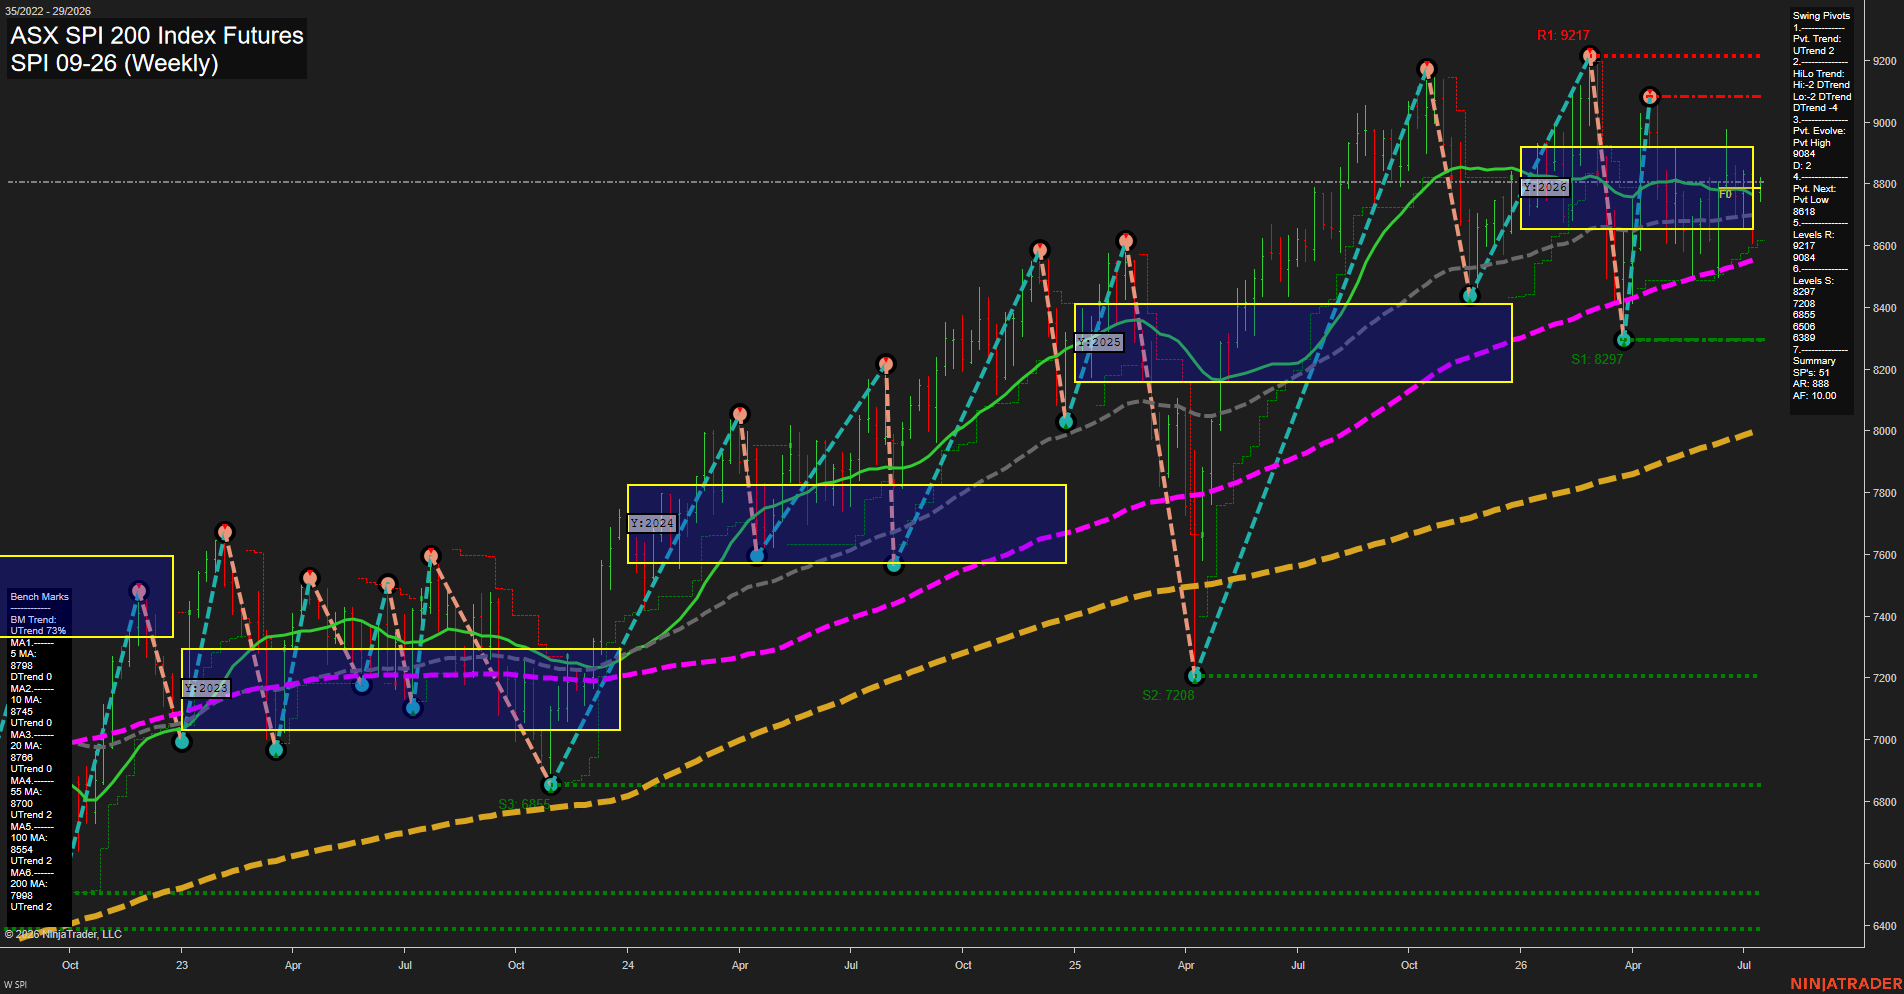
SPI ASX SPI 200 Index Futures Weekly Chart Analysis: 2026-Jul-13 07:07 CT
Price Action
- Last: 8780,
- Bars: Large,
- Mom: average.
WSFG Weekly
- Short-Term
- WSFG Current: NA%
- F0%/NTZ' Bias: Price Neutral,
- WSFG Trend: Neutral.
MSFG Month Jul
- Intermediate-Term
- MSFG Current: NA%
- F0%/NTZ' Bias: Price Neutral,
- MSFG Trend: Neutral.
YSFG Year 2026
- Long-Term
- YSFG Current: NA%
- F0%/NTZ' Bias: Price Neutral,
- YSFG Trend: Neutral.
Swing Pivots
- (Short-Term) 1. Pvt. Trend: UTrend,
- (Intermediate-Term) 2. HiLo Trend: DTrend,
- 3. Pvt. Evolve: Pvt High 9084,
- 4. Pvt. Next: Pvt Low 8618,
- 5. Levels R: 9217, 9084,
- 6. Levels S: 8297, 7208, 6855, 6506, 6389.
Weekly Benchmarks
- (Short-Term) 5 Day: 8798 Down Trend,
- (Short-Term) 10 Day: 8745 Up Trend,
- (Intermediate-Term) 20 Day: 8768 Up Trend,
- (Intermediate-Term) 55 Day: 8700 Up Trend,
- (Long-Term) 100 Day: 8554 Up Trend,
- (Long-Term) 200 Day: 7988 Up Trend.
Overall Rating
- Short-Term: Neutral,
- Intermediate-Term: Bullish,
- Long-Term: Bullish.
Key Insights Summary
Weekly structure remains in a broader uptrend, with price holding above the 10, 20, 55, 100 and 200 day benchmarks while the 5 day sits just above current price, reflecting a near-term pause rather than a full trend break. The swing pivot framework still shows an upward short-term pivot trend, but the intermediate HiLo trend is in a declining phase, consistent with a pullback inside a larger advance. Price is trading within the 2026 yearly NTZ band, leaving the long-term backdrop balanced to constructive rather than extended. Resistance is clearly defined near 9084 and 9217, while support is layered at 8618 then 8297 and 7208, matching the chart’s recent rally-retrace-rally rhythm. The overall swing trader read is consolidation after a strong run, with higher-timeframe trend support still intact and the current weekly action sitting near the middle of the recent range.
Chart Analysis ATS AI Generated: 2026-07-13 07:07 for Informational use only, not trading advice. Terms and Risk Disclosure Copyright © 2026. Algo Trading Systems LLC.