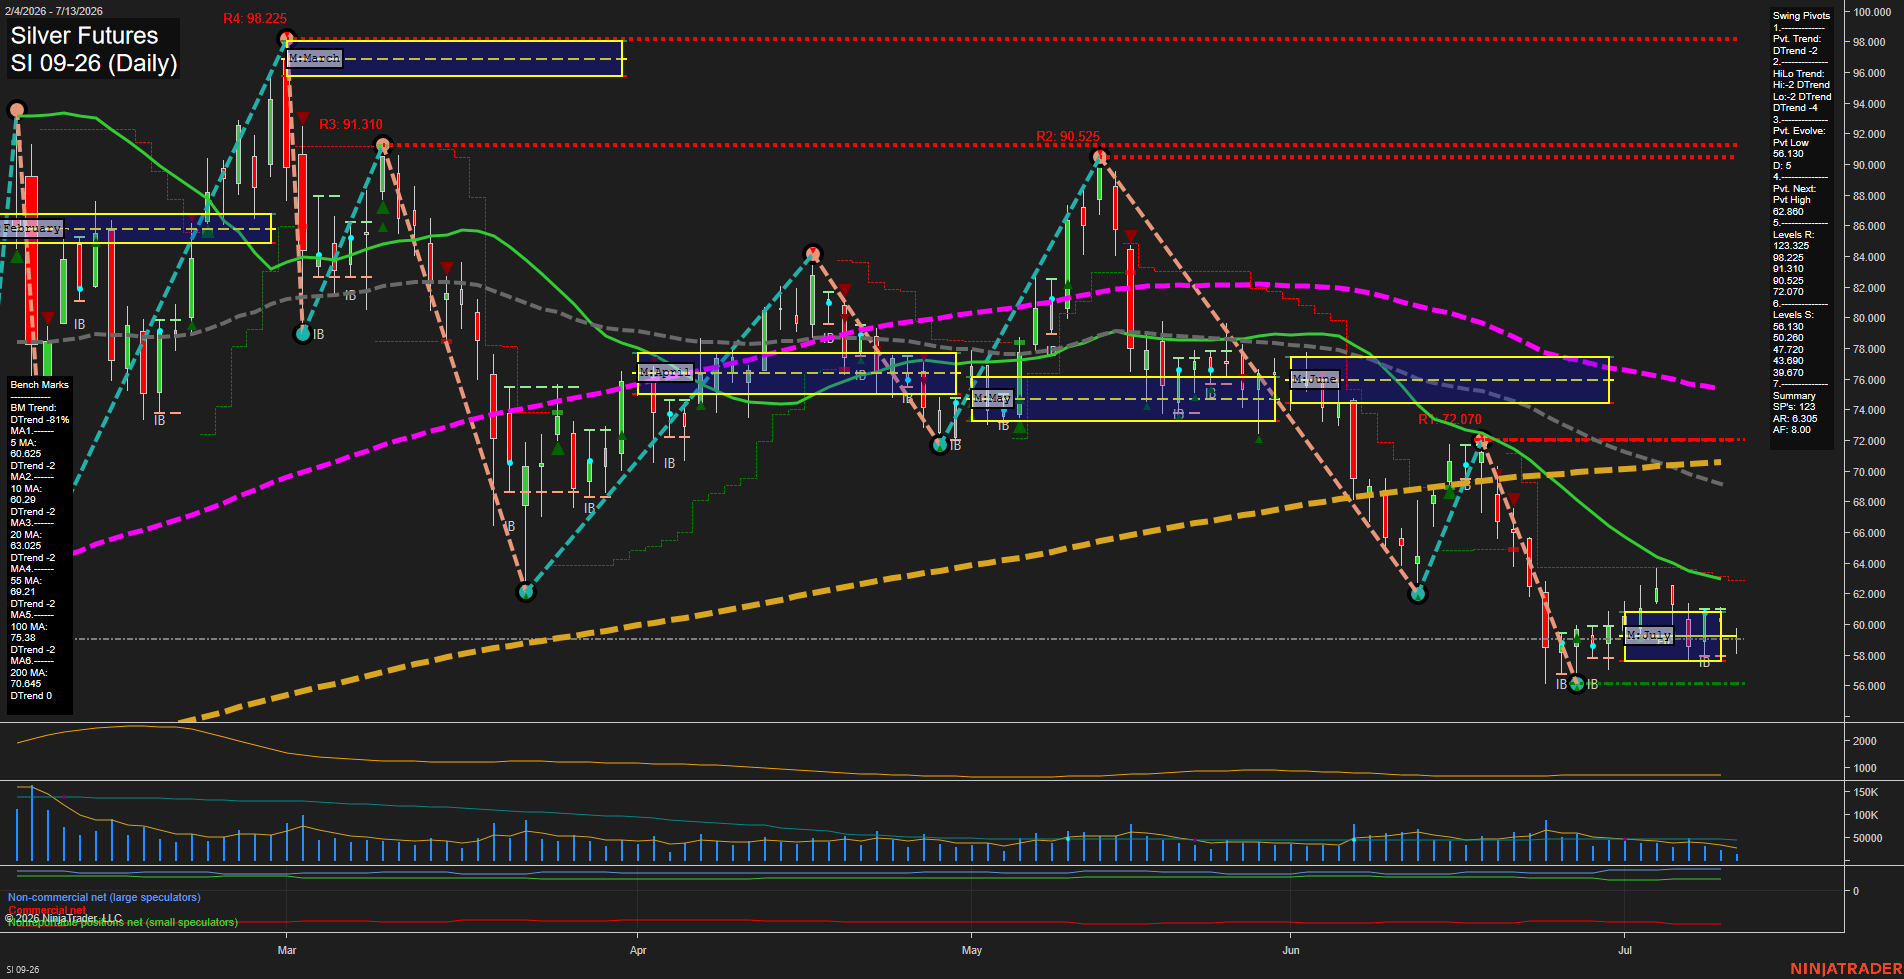
SI Silver Futures Daily Chart Analysis: 2026-Jul-13 07:06 CT
Price Action
- Last: 58.435,
- Bars: Small,
- Mom: slow.
WSFG Weekly
- Short-Term
- WSFG Current: -10%
- F0%/NTZ' Bias: Price Below,
- WSFG Trend: Down.
MSFG Month Jul
- Intermediate-Term
- MSFG Current: 3%
- F0%/NTZ' Bias: Price Above,
- MSFG Trend: Up.
YSFG Year 2026
- Long-Term
- YSFG Current: -183%
- F0%/NTZ' Bias: Price Below,
- YSFG Trend: Down.
Swing Pivots
- (Short-Term) 1. Pvt. Trend: DTrend,
- (Intermediate-Term) 2. HiLo Trend: DTrend,
- 3. Pvt. Evolve: Pvt Low 58.130,
- 4. Pvt. Next: Pvt High 62.860,
- 5. Levels R: 123.325, 98.225, 91.310, 90.525, 72.070,
- 6. Levels S: 58.130, 50.260, 47.720, 43.690, 39.730.
Daily Benchmarks
- (Short-Term) 5 Day: 60.625 Down Trend,
- (Short-Term) 10 Day: 60.290 Down Trend,
- (Intermediate-Term) 20 Day: 63.025 Down Trend,
- (Intermediate-Term) 55 Day: 69.210 Down Trend,
- (Long-Term) 100 Day: 75.380 Down Trend,
- (Long-Term) 200 Day: 70.645 Down Trend.
Additional Metrics
Recent Trade Signals
- 13 Jul 2026: Short SI 09-26 @ 58.435 Signals.USAR-WSFG
- 10 Jul 2026: Long SI 09-26 @ 60.38 Signals.USAR-MSFG
- 09 Jul 2026: Long SI 09-26 @ 60.765 Signals.USAR.TR120
Overall Rating
- Short-Term: Bearish,
- Intermediate-Term: Bearish,
- Long-Term: Bearish.
Key Insights Summary
Silver futures are pressing into the lower end of the July range after a persistent multi-month decline, with price sitting below all daily benchmarks and the pivot structure still in DTrend. The chart shows a late-stage selloff followed by a brief stabilization inside the current July NTZ, but the broader tape remains controlled by lower highs, lower lows, and failed recovery attempts under the 20, 55, 100, and 200 day averages. Weekly positioning is below its NTZ bias while the monthly setup is the only constructive layer, reflecting a short-term countertrend lift inside an otherwise weak higher-timeframe structure. Swing pivot levels show nearby support at 58.130 with overhead pivot resistance at 62.860, while the broader resistance stack remains far above current price. Volume and ATR indicate active but not explosive trade conditions, consistent with a market that is digesting a sharp decline rather than reversing it.
Chart Analysis ATS AI Generated: 2026-07-13 07:06 for Informational use only, not trading advice. Terms and Risk Disclosure Copyright © 2026. Algo Trading Systems LLC.