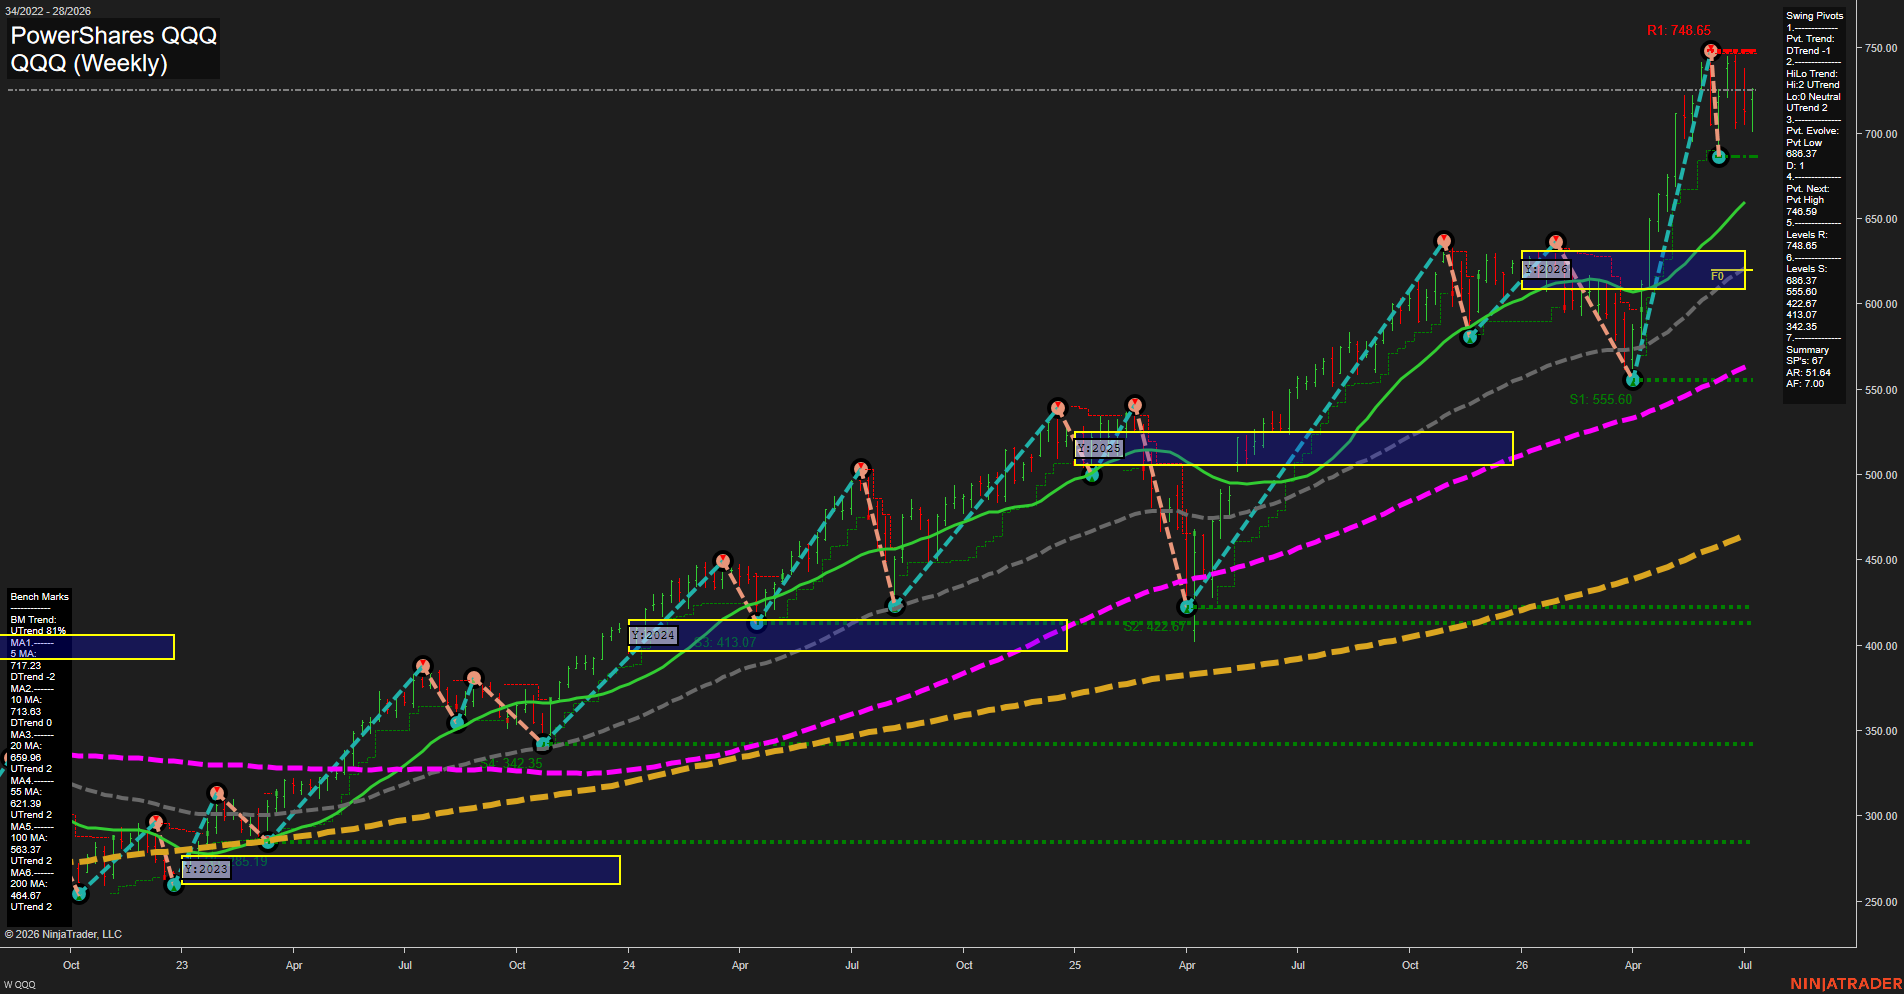
QQQ PowerShares QQQ Weekly Chart Analysis: 2026-Jul-13 07:05 CT
Price Action
- Last: 743.00,
- Bars: Large,
- Mom: fast.
WSFG Weekly
- Short-Term
- WSFG Current: NA%
- F0%/NTZ' Bias: Price Neutral,
- WSFG Trend: Neutral.
MSFG Month Jul
- Intermediate-Term
- MSFG Current: NA%
- F0%/NTZ' Bias: Price Neutral,
- MSFG Trend: Neutral.
YSFG Year 2026
- Long-Term
- YSFG Current: NA%
- F0%/NTZ' Bias: Price Neutral,
- YSFG Trend: Neutral.
Swing Pivots
- (Short-Term) 1. Pvt. Trend: DTrend,
- (Intermediate-Term) 2. HiLo Trend: UTrend,
- 3. Pvt. Evolve: Pvt Low 688.37,
- 4. Pvt. Next: Pvt High 748.59,
- 5. Levels R: 748.65,
- 6. Levels S: 688.37, 555.60, 422.67, 413.07, 342.35.
Weekly Benchmarks
- (Short-Term) 5 Day: 717.23 Down Trend,
- (Short-Term) 10 Day: 713.63 Down Trend,
- (Intermediate-Term) 20 Day: 659.96 Up Trend,
- (Intermediate-Term) 55 Day: 621.39 Up Trend,
- (Long-Term) 100 Day: 583.37 Up Trend,
- (Long-Term) 200 Day: 464.67 Up Trend.
Overall Rating
- Short-Term: Bearish,
- Intermediate-Term: Bullish,
- Long-Term: Bullish.
Key Insights Summary
QQQ remains in a powerful long-duration uptrend, with price holding far above the 20, 55, 100, and 200-day benchmarks and the longer swing structure still defined by higher highs and higher lows. The weekly tape is elevated near the upper end of the 2026 yearly fib zone, with price pressing into prior swing-high resistance around 748.65 after a sharp expansion leg. Short-term conditions have turned softer as the 5 and 10-day benchmarks roll down and the current pivot trend registers DTrend, reflecting a near-term pullback or consolidation phase after the recent vertical advance. Intermediate and long-term structure remain constructive, supported by the rising benchmark stack and the intact higher-level swing framework.
Chart Analysis ATS AI Generated: 2026-07-13 07:06 for Informational use only, not trading advice. Terms and Risk Disclosure Copyright © 2026. Algo Trading Systems LLC.