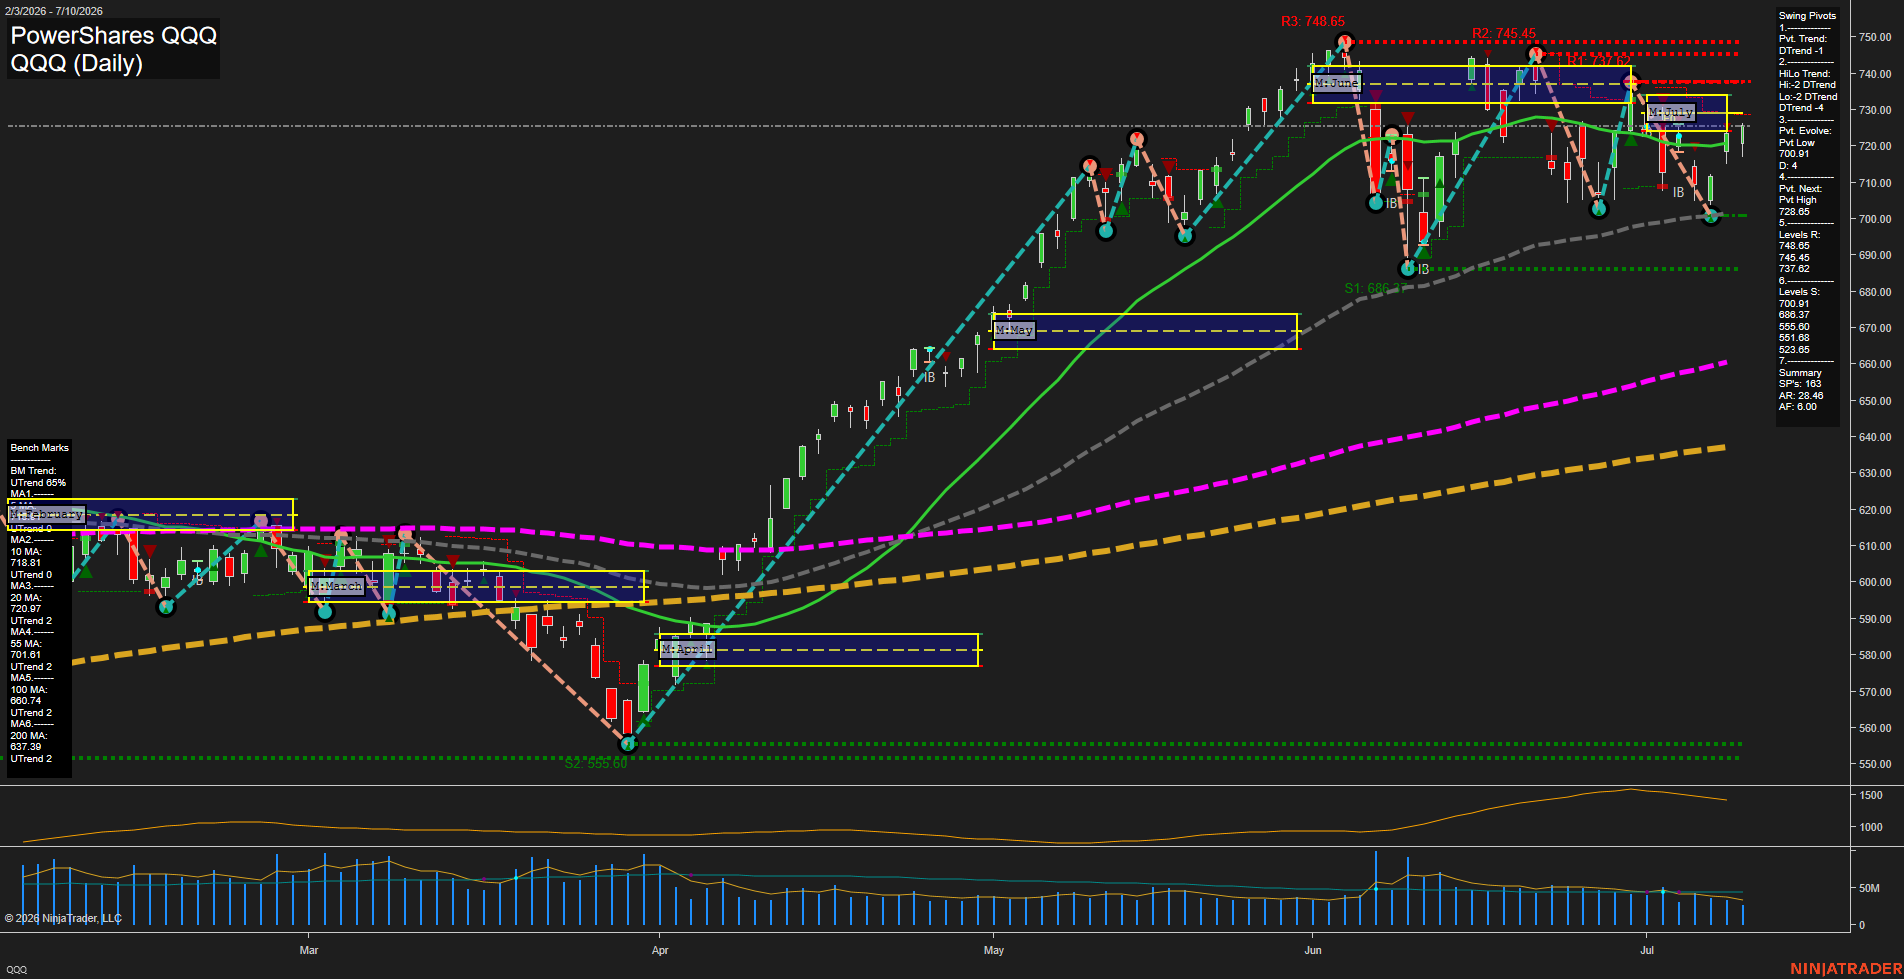
QQQ PowerShares QQQ Daily Chart Analysis: 2026-Jul-13 07:05 CT
Price Action
- Last: 723.00,
- Bars: Medium,
- Mom: average.
WSFG Weekly
- Short-Term
- WSFG Current: NA%
- F0%/NTZ' Bias: Price Neutral,
- WSFG Trend: Neutral.
MSFG Month Jul
- Intermediate-Term
- MSFG Current: NA%
- F0%/NTZ' Bias: Price Neutral,
- MSFG Trend: Neutral.
YSFG Year 2026
- Long-Term
- YSFG Current: NA%
- F0%/NTZ' Bias: Price Neutral,
- YSFG Trend: Neutral.
Swing Pivots
- (Short-Term) 1. Pvt. Trend: DTrend,
- (Intermediate-Term) 2. HiLo Trend: DTrend,
- 3. Pvt. Evolve: Pvt low 700.91,
- 4. Pvt. Next: Pvt high 728.65,
- 5. Levels R: 748.65, 745.45, 737.62,
- 6. Levels S: 700.91, 688.37, 555.60, 551.68, 523.65.
Daily Benchmarks
- (Short-Term) 5 Day: 724.00 Up Trend,
- (Short-Term) 10 Day: 718.81 Up Trend,
- (Intermediate-Term) 20 Day: 720.97 Up Trend,
- (Intermediate-Term) 55 Day: 701.61 Up Trend,
- (Long-Term) 100 Day: 680.74 Up Trend,
- (Long-Term) 200 Day: 637.39 Up Trend.
Additional Metrics
- ATR: 28.46,
- VOLMA: 32709273.
Overall Rating
- Short-Term: Neutral,
- Intermediate-Term: Bullish,
- Long-Term: Bullish.
Key Insights Summary
QQQ is coming off a strong multi-month advance that accelerated sharply from the April low into the June peak near 748, followed by a July pullback and consolidation phase. The short-term pivot structure has rolled to DTrend with lower highs and lower lows developing under the recent resistance band, while the broader trend remains constructive because price is still holding well above the rising 55, 100, and 200 day benchmarks. The chart is showing a transition from impulse rally to digestion, with the current action centered between the upper 700s resistance zone and the low 700s support zone. Volume has cooled from the breakout phase, and the ATR remains elevated enough to reflect active two-way movement, but not a breakdown in the higher-timeframe trend.
Chart Analysis ATS AI Generated: 2026-07-13 07:05 for Informational use only, not trading advice. Terms and Risk Disclosure Copyright © 2026. Algo Trading Systems LLC.