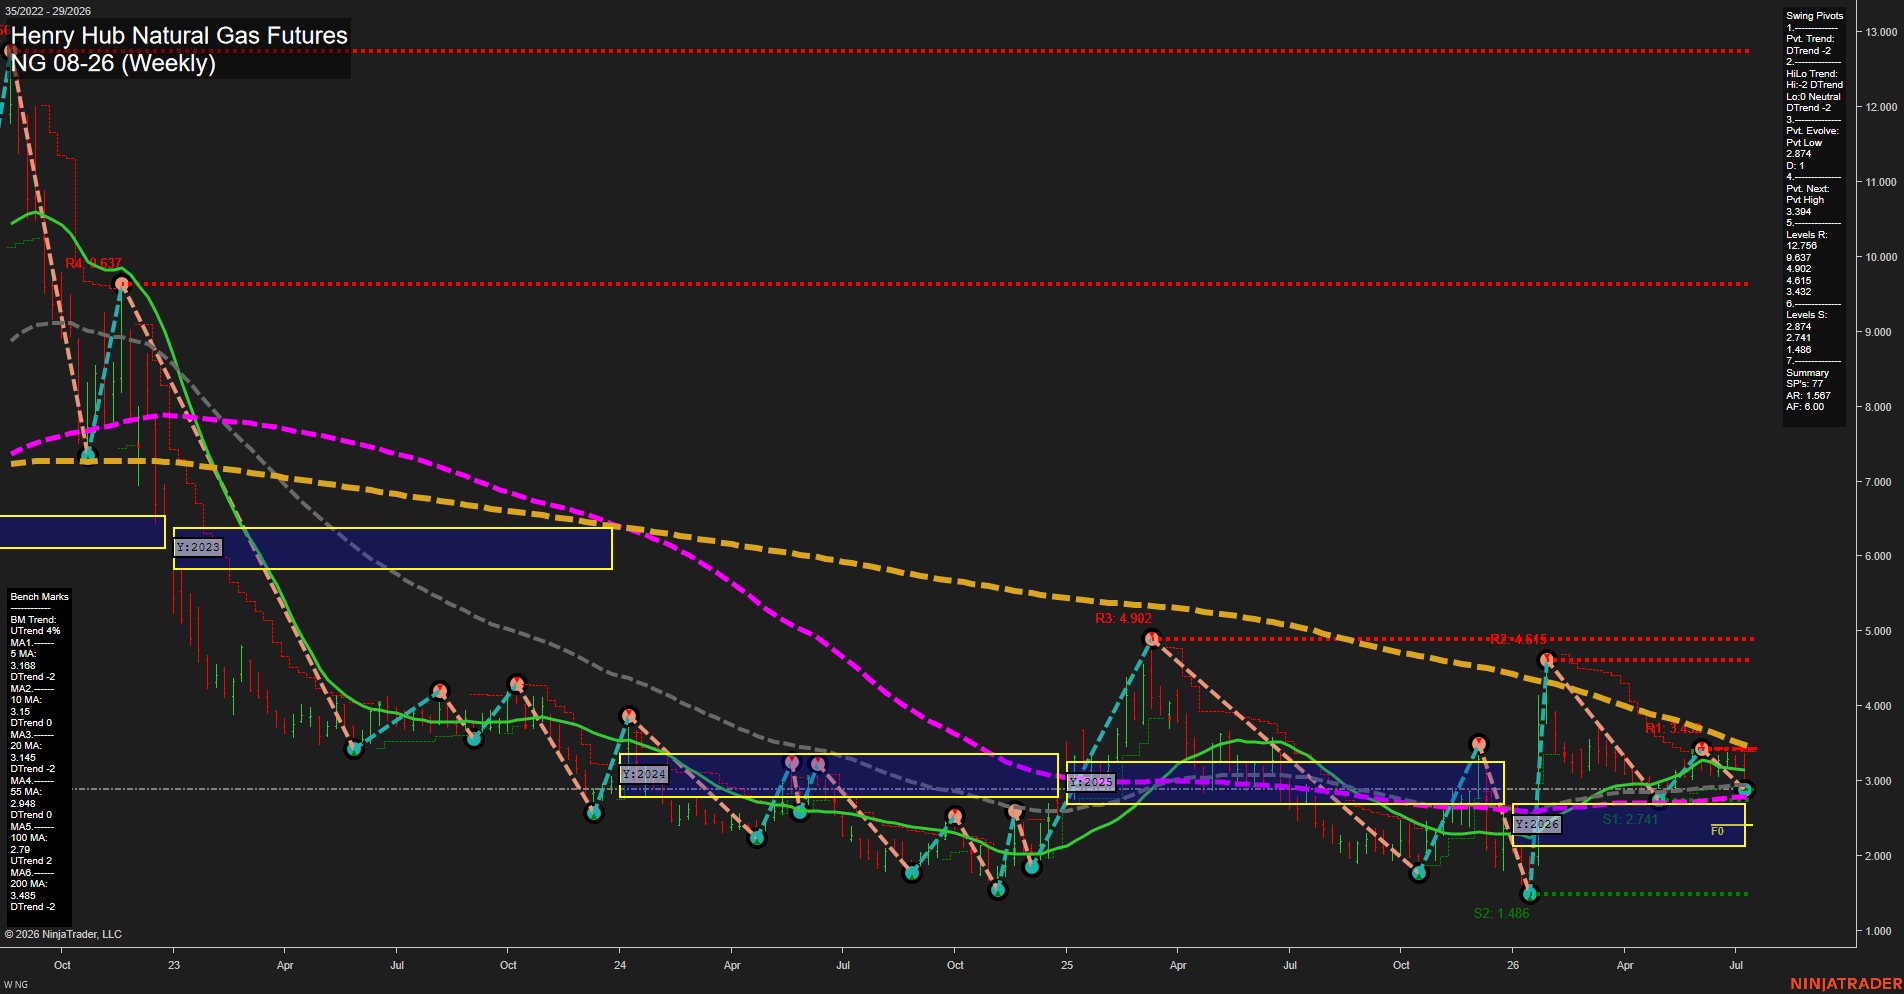
NG Henry Hub Natural Gas Futures Weekly Chart Analysis: 2026-Jul-13 07:04 CT
Price Action
- Last: 2.891,
- Bars: Medium,
- Mom: Slow.
WSFG Weekly
- Short-Term
- WSFG Current: -14%
- F0%/NTZ' Bias: Price Below,
- WSFG Trend: Down.
MSFG Month Jul
- Intermediate-Term
- MSFG Current: -78%
- F0%/NTZ' Bias: Price Below,
- MSFG Trend: Down.
YSFG Year 2026
- Long-Term
- YSFG Current: 17%
- F0%/NTZ' Bias: Price Above,
- YSFG Trend: Up.
Swing Pivots
- (Short-Term) 1. Pvt. Trend: DTrend,
- (Intermediate-Term) 2. HiLo Trend: DTrend,
- 3. Pvt. Evolve: Pvt Low 2.874,
- 4. Pvt. Next: Pvt High 5.394,
- 5. Levels R: 12.758, 9.637, 4.902, 4.615, 3.432,
- 6. Levels S: 2.874, 2.741, 1.486.
Weekly Benchmarks
- (Short-Term) 5 Day: 3.168 Down Trend,
- (Short-Term) 10 Day: 3.15 Down Trend,
- (Intermediate-Term) 20 Day: 3.145 Down Trend,
- (Intermediate-Term) 55 Day: 2.948 Down Trend,
- (Long-Term) 100 Day: 2.79 Up Trend,
- (Long-Term) 200 Day: 3.485 Down Trend.
Recent Trade Signals
- 13 Jul 2026: Short NG 08-26 @ 2.891 Signals.USAR-WSFG
- 09 Jul 2026: Short NG 08-26 @ 3.03 Signals.USAR.TR720
- 09 Jul 2026: Short NG 08-26 @ 3.203 Signals.USAR-MSFG
- 07 Jul 2026: Long NG 08-26 @ 3.272 Signals.USAR.TR120
Overall Rating
- Short-Term: Bearish,
- Intermediate-Term: Bearish,
- Long-Term: Bullish.
Key Insights Summary
Weekly natural gas is still trading in a broad downtrend structure with a slow momentum profile and price holding below the weekly and monthly F0/NTZ centers, which keeps the short- and intermediate-term tone weak. The pivot structure remains DTrend on both the short-term and HiLo readings, while the nearest support cluster sits at 2.874 and 2.741 with the next pivot high mapped higher at 5.394, showing a market that is still operating inside a wider swing range after a sharp 2026 selloff and rebound sequence. The 2026 yearly session remains positive above its F0/NTZ bias, so the longer-cycle backdrop is constructive even though the weekly tape is consolidative and under pressure. Benchmarks are mixed but still mostly weighted to the downside in the nearer averages, with price under the 5, 10, 20, 55, and 200-day references and only the 100-day showing an upward long-term slope. Recent signals align with the weaker weekly and monthly posture, favoring the prevailing downside swing rhythm while the yearly framework continues to hold a bullish structural bias.
Chart Analysis ATS AI Generated: 2026-07-13 07:05 for Informational use only, not trading advice. Terms and Risk Disclosure Copyright © 2026. Algo Trading Systems LLC.