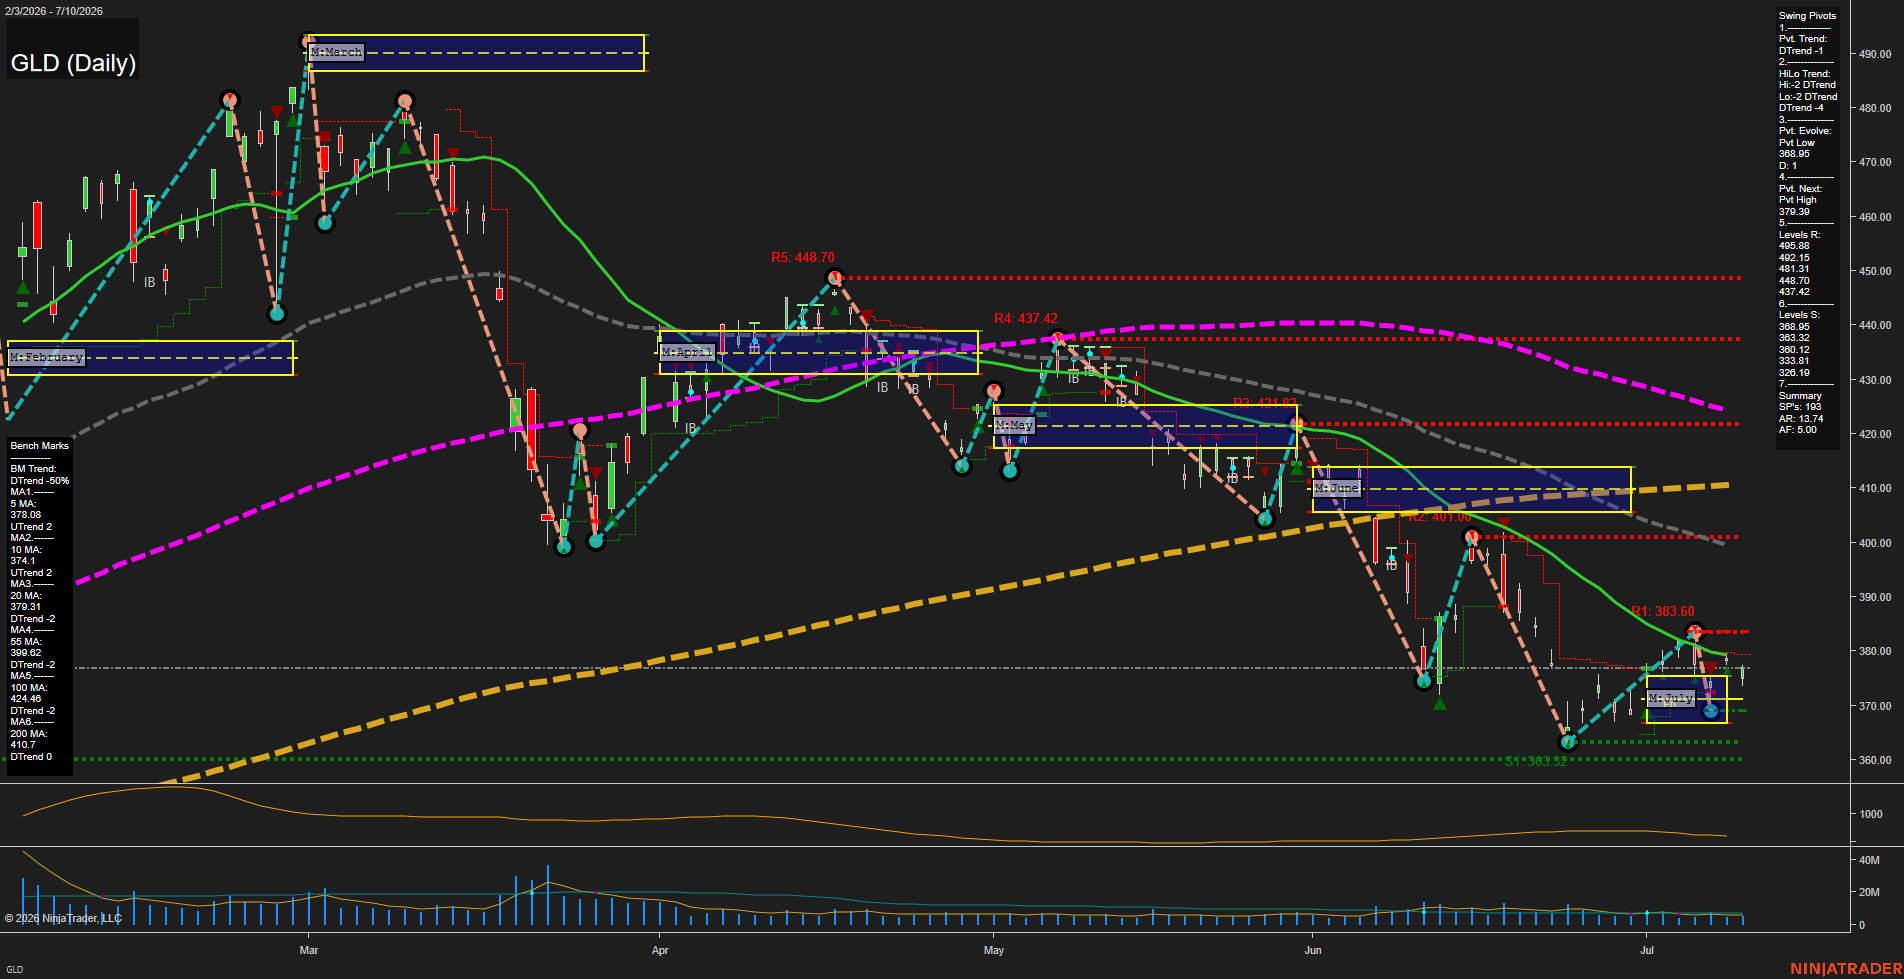
GLD SPDR Gold Shares Daily Chart Analysis: 2026-Jul-13 07:04 CT
Price Action
- Last: 376.9,
- Bars: Small,
- Mom: Slow.
WSFG Weekly
- Short-Term
- WSFG Current: NA%
- F0%/NTZ' Bias: Price Neutral,
- WSFG Trend: Neutral.
MSFG Month Jul
- Intermediate-Term
- MSFG Current: NA%
- F0%/NTZ' Bias: Price Neutral,
- MSFG Trend: Neutral.
YSFG Year 2026
- Long-Term
- YSFG Current: NA%
- F0%/NTZ' Bias: Price Neutral,
- YSFG Trend: Neutral.
Swing Pivots
- (Short-Term) 1. Pvt. Trend: DTrend,
- (Intermediate-Term) 2. HiLo Trend: DTrend,
- 3. Pvt. Evolve: Pvt Low 368.95,
- 4. Pvt. Next: Pvt High 379.38,
- 5. Levels R: 495.88, 492.15, 481.31, 448.70, 437.42,
- 6. Levels S: 368.95, 363.32, 360.12, 333.81, 326.19.
Daily Benchmarks
- (Short-Term) 5 Day: 378.08 Up Trend,
- (Short-Term) 10 Day: 374.10 Up Trend,
- (Intermediate-Term) 20 Day: 379.31 Down Trend,
- (Intermediate-Term) 55 Day: 399.62 Down Trend,
- (Long-Term) 100 Day: 424.46 Down Trend,
- (Long-Term) 200 Day: 410.70 Down Trend.
Additional Metrics
- ATR: 13.74,
- VOLMA: 7207880.
Overall Rating
- Short-Term: Bearish,
- Intermediate-Term: Bearish,
- Long-Term: Bearish.
Key Insights Summary
GLD is in a corrective swing structure with a downward pivot trend and a lower-high/lower-low sequence dominating the tape. Price is sitting near the 5-day and 10-day benchmarks, but remains below the 20-day, 55-day, 100-day, and 200-day averages, which keeps the broader alignment negative. The current monthly and weekly session grids are neutral on the bias read, but the daily structure shows failed rebound attempts and repeated rejection beneath overhead pivot resistance. Recent candles are relatively small, suggesting slower momentum after the prior selloff, yet the chart still reflects a bearish trend regime with consolidation under nearby resistance and support being tested in the upper-360s to high-370s zone.
Chart Analysis ATS AI Generated: 2026-07-13 07:04 for Informational use only, not trading advice. Terms and Risk Disclosure Copyright © 2026. Algo Trading Systems LLC.