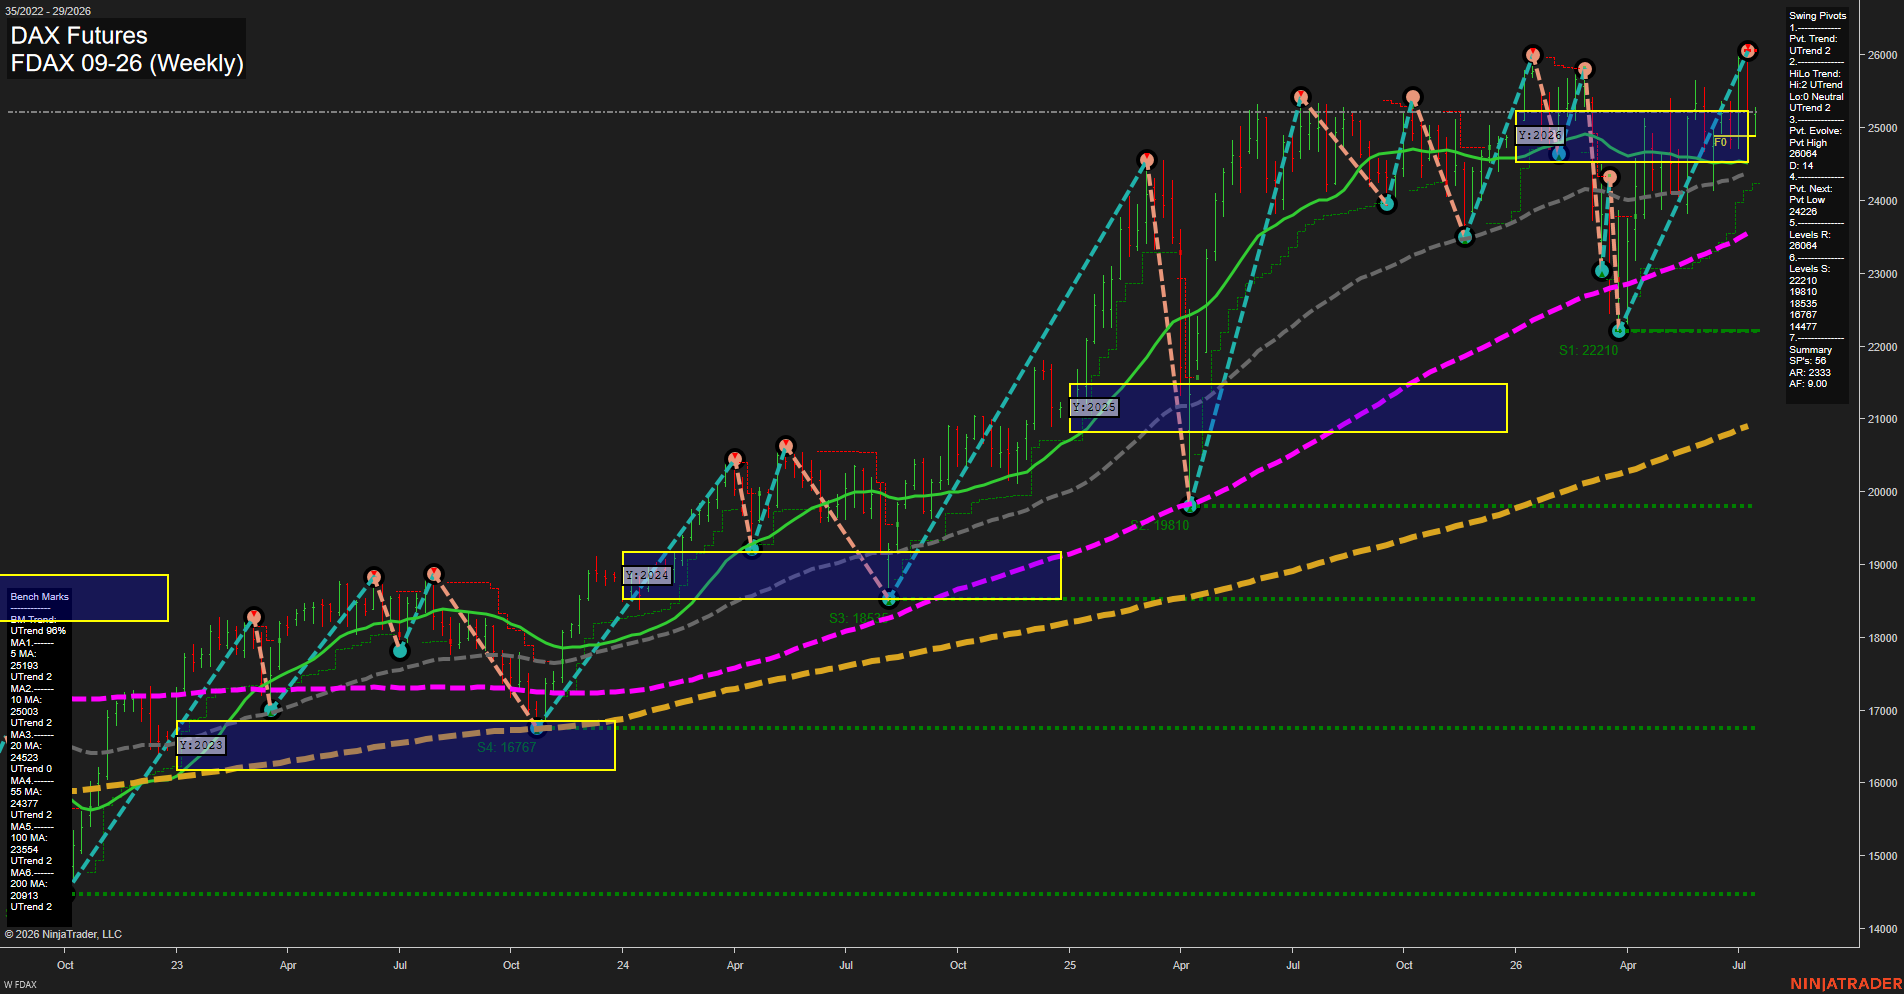
FDAX DAX Futures Weekly Chart Analysis: 2026-Jul-13 07:03 CT
Price Action
- Last: 26064,
- Bars: Large,
- Mom: fast.
WSFG Weekly
- Short-Term
- WSFG Current: 5%
- F0%/NTZ' Bias: Price Above,
- WSFG Trend: Up.
MSFG Month Jul
- Intermediate-Term
- MSFG Current: 4%
- F0%/NTZ' Bias: Price Above,
- MSFG Trend: Up.
YSFG Year 2026
- Long-Term
- YSFG Current: 9%
- F0%/NTZ' Bias: Price Above,
- YSFG Trend: Up.
Swing Pivots
- (Short-Term) 1. Pvt. Trend: UTrend,
- (Intermediate-Term) 2. HiLo Trend: UTrend,
- 3. Pvt. Evolve: Pvt High 26064,
- 4. Pvt. Next: Pvt Low 24226,
- 5. Levels R: 26064,
- 6. Levels S: 22210, 19810, 18535, 16767.
Weekly Benchmarks
- (Short-Term) 5 Day: 25193 Up Trend,
- (Short-Term) 10 Day: 25003 Up Trend,
- (Intermediate-Term) 20 Day: 24523 Up Trend,
- (Intermediate-Term) 55 Day: 24377 Up Trend,
- (Long-Term) 100 Day: 23554 Up Trend,
- (Long-Term) 200 Day: 20913 Up Trend.
Recent Trade Signals
- 13 Jul 2026: Long FDAX 09-26 @ 25260 Signals.USAR-WSFG
- 07 Jul 2026: Short FDAX 09-26 @ 25643 Signals.USAR.TR120
Overall Rating
- Short-Term: Bullish,
- Intermediate-Term: Bullish,
- Long-Term: Bullish.
Key Insights Summary
FDAX remains in a strong multi-timeframe uptrend with price pressing back into the upper end of the 2026 yearly session fib structure and holding well above the key benchmark moving averages. The weekly structure is dominated by higher highs and higher lows, with the latest pivot sequence confirming an active UTrend and a fresh swing high at 26064. The recent Long signal aligns with the broader bullish posture, while the earlier short reflects the prior pullback/reversal phase that has now been overtaken by renewed upside continuation. The chart shows a mature advance with periodic sharp retracements and immediate recoveries, but trend control remains with the bulls across weekly, monthly, and yearly frames.
Chart Analysis ATS AI Generated: 2026-07-13 07:03 for Informational use only, not trading advice. Terms and Risk Disclosure Copyright © 2026. Algo Trading Systems LLC.