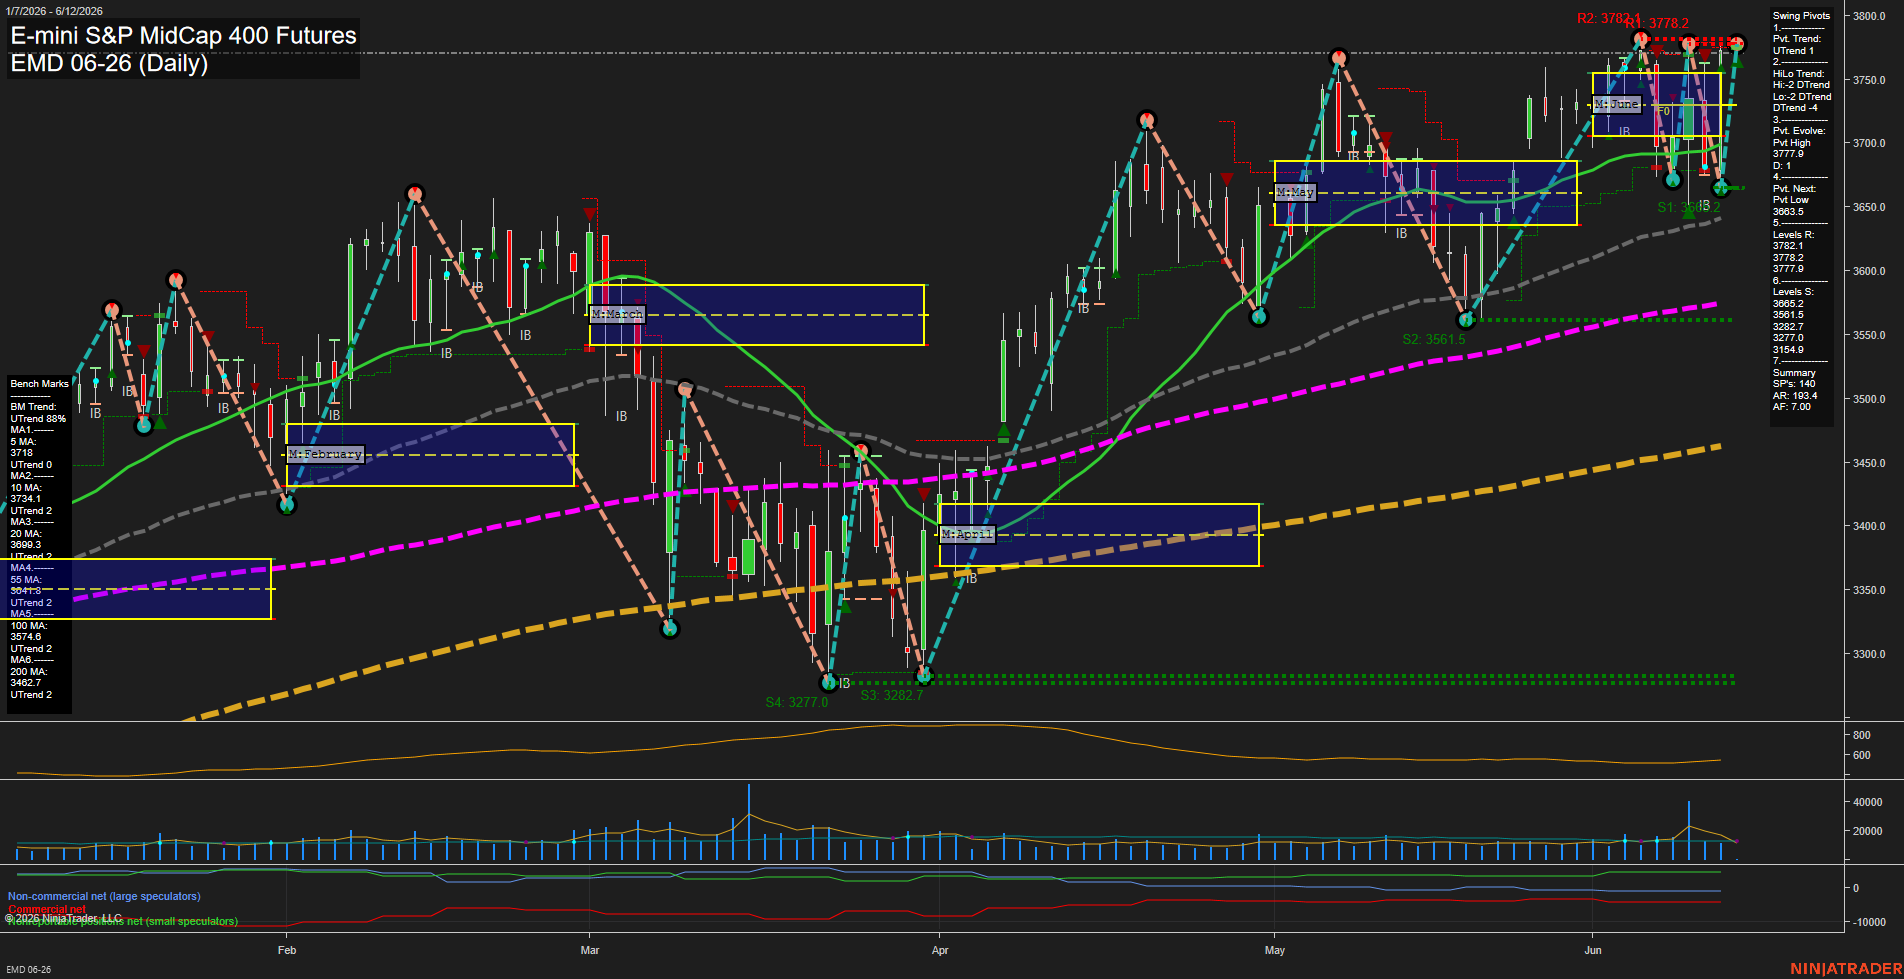
EMD E-mini S&P MidCap 400 Futures Daily Chart Analysis: 2026-Jul-13 07:02 CT
Price Action
- Last: 3780.0,
- Bars: Large,
- Mom: fast.
WSFG Weekly
- Short-Term
- WSFG Current: 8%
- F0%/NTZ' Bias: Price Above,
- WSFG Trend: Up.
MSFG Month Jul
- Intermediate-Term
- MSFG Current: -32%
- F0%/NTZ' Bias: Price Below,
- MSFG Trend: Down.
YSFG Year 2026
- Long-Term
- YSFG Current: 57%
- F0%/NTZ' Bias: Price Above,
- YSFG Trend: Up.
Swing Pivots
- (Short-Term) 1. Pvt. Trend: UTrend,
- (Intermediate-Term) 2. HiLo Trend: DTrend,
- 3. Pvt. Evolve: Pvt High 3777.9,
- 4. Pvt. Next: Pvt Low 3683.5,
- 5. Levels R: 3782.1, 3778.2, 3777.9,
- 6. Levels S: 3686.2, 3685.2, 3683.5, 3682.7.
Daily Benchmarks
- (Short-Term) 5 Day: 3718.0 Up Trend,
- (Short-Term) 10 Day: 3734.1 Up Trend,
- (Intermediate-Term) 20 Day: 3699.3 Up Trend,
- (Intermediate-Term) 55 Day: 3647.8 Up Trend,
- (Long-Term) 100 Day: 3574.6 Up Trend,
- (Long-Term) 200 Day: 3462.7 Up Trend.
Additional Metrics
Recent Trade Signals
- 09 Jul 2026: Long EMD 09-26 @ 3817.9 Signals.USAR.TR120
- 08 Jul 2026: Short EMD 09-26 @ 3726.4 Signals.USAR.TR720
- 07 Jul 2026: Short EMD 09-26 @ 3805.3 Signals.USAR-WSFG
Overall Rating
- Short-Term: Bullish,
- Intermediate-Term: Neutral,
- Long-Term: Bullish.
Key Insights Summary
The daily structure remains impulsive and elevated, with price pressing into the upper resistance band after a strong recovery leg from the spring troughs. Short-term momentum is bullish and the weekly fib grid sits above its midpoint, while the monthly grid still reflects a negative intermediate reading and a down bias from the July session context. The pivot structure shows a fresh higher-high phase with nearby overhead resistance clustered tightly at the top, while support is layered below around the upper 3680s and then the mid-3600s. All benchmark moving averages are aligned in rising order, which supports the broader uptrend even as the intermediate monthly session remains in a corrective posture. Recent signal flow has been mixed, with the latest long signal following prior short signals, matching the choppy but upward-biased swing cycle.
Chart Analysis ATS AI Generated: 2026-07-13 07:02 for Informational use only, not trading advice. Terms and Risk Disclosure Copyright © 2026. Algo Trading Systems LLC.