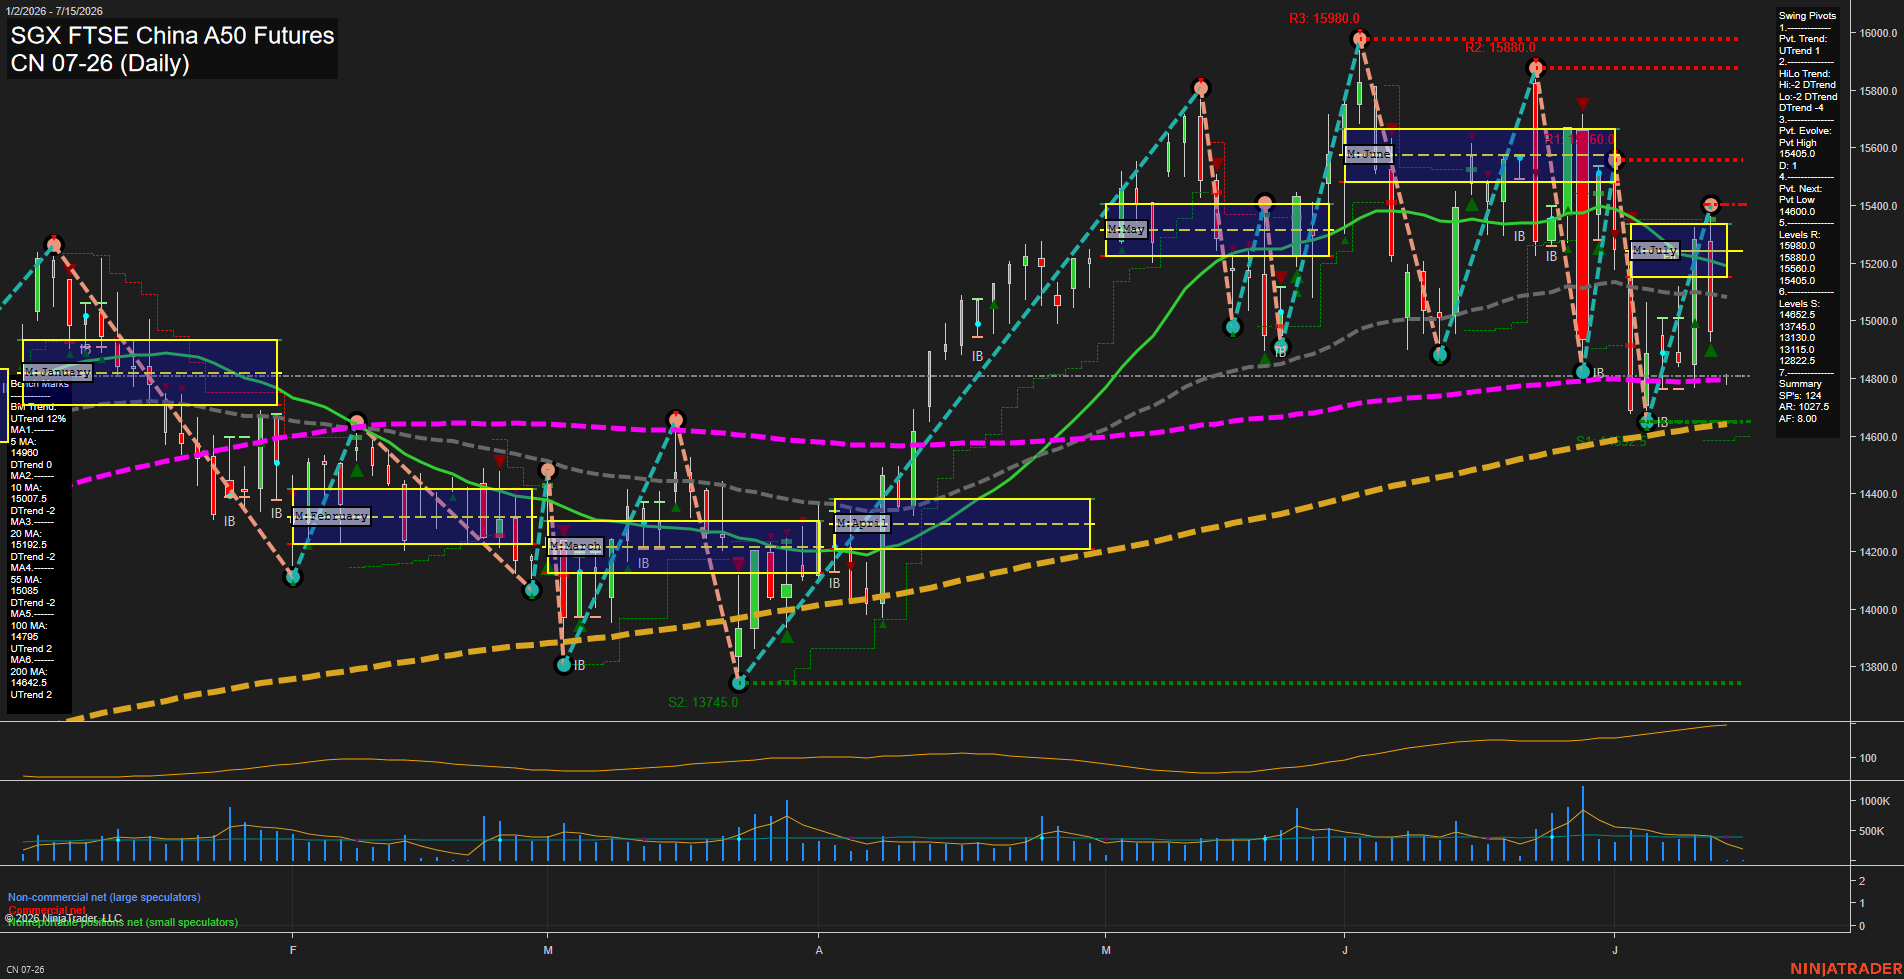
CN SGX FTSE China A50 Futures Daily Chart Analysis: 2026-Jul-13 07:02 CT
Price Action
- Last: 15280,
- Bars: Large,
- Mom: fast.
WSFG Weekly
- Short-Term
- WSFG Current: NA%
- F0%/NTZ' Bias: Price Neutral,
- WSFG Trend: Neutral.
MSFG Month Jul
- Intermediate-Term
- MSFG Current: NA%
- F0%/NTZ' Bias: Price Neutral,
- MSFG Trend: Neutral.
YSFG Year 2026
- Long-Term
- YSFG Current: NA%
- F0%/NTZ' Bias: Price Neutral,
- YSFG Trend: Neutral.
Swing Pivots
- (Short-Term) 1. Pvt. Trend: UTrend,
- (Intermediate-Term) 2. HiLo Trend: DTrend,
- 3. Pvt. Evolve: Pvt High 15405.0,
- 4. Pvt. Next: Pvt Low 14680.0,
- 5. Levels R: 15980.0, 15880.0, 15405.0,
- 6. Levels S: 14862.5, 13745.0, 13130.0, 13115.0, 12822.5.
Daily Benchmarks
- (Short-Term) 5 Day: 14960.0 Down Trend,
- (Short-Term) 10 Day: 15007.5 Down Trend,
- (Intermediate-Term) 20 Day: 15192.5 Down Trend,
- (Intermediate-Term) 55 Day: 15085.0 Down Trend,
- (Long-Term) 100 Day: 14795.0 Up Trend,
- (Long-Term) 200 Day: 14642.5 Up Trend.
Additional Metrics
- ATR: 87.5,
- VOLMA: 261842.
Overall Rating
- Short-Term: Neutral,
- Intermediate-Term: Neutral,
- Long-Term: Bullish.
Key Insights Summary
The daily structure shows a fast-moving, wide-range swing environment with repeated expansion and contraction around the upper mid-range of the prior month’s session grid. Price has recovered sharply from the spring lows and is now trading well above the long-term 100 and 200 day benchmarks, while still sitting in a mixed zone beneath the most recent resistance band near 15405 to 15980. Swing pivot trend remains constructive on the short-term side, but the higher-timeframe hi/lo pivot structure is still mixed, reflecting a market that has not fully resolved the latest push and pull sequence. The chart shows several inside-bar and rejection-type sessions, indicating consolidation after the latest impulse leg, with nearby resistance overhead and layered support below. Overall, the tape is transitioning from a recovery phase into a choppy upper-range consolidation phase, with long-term structure still positive and the short-term path dominated by reactive swings around the current monthly value area.
Chart Analysis ATS AI Generated: 2026-07-13 07:02 for Informational use only, not trading advice. Terms and Risk Disclosure Copyright © 2026. Algo Trading Systems LLC.