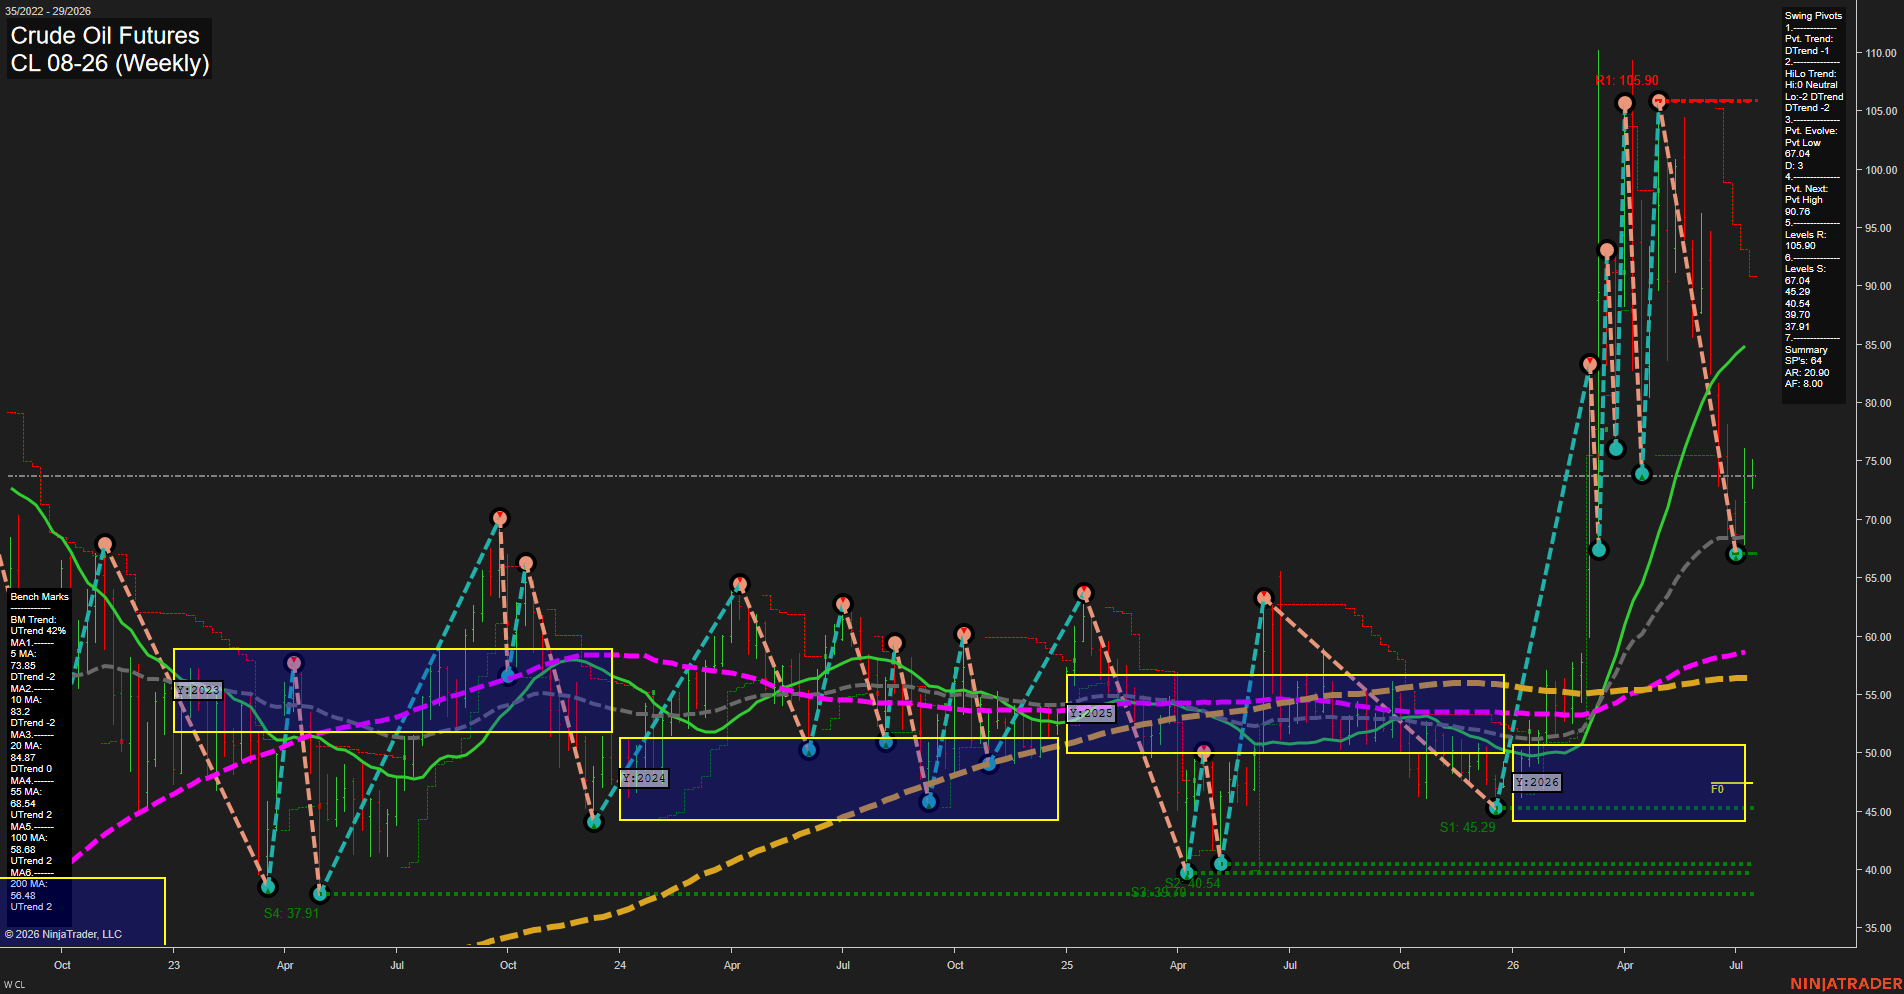
CL Crude Oil Futures Weekly Chart Analysis: 2026-Jul-13 07:01 CT
Price Action
- Last: 67.04,
- Bars: Large,
- Mom: Fast.
WSFG Weekly
- Short-Term
- WSFG Current: 2%
- F0%/NTZ' Bias: Price Above,
- WSFG Trend: Up.
MSFG Month Jul
- Intermediate-Term
- MSFG Current: 15%
- F0%/NTZ' Bias: Price Above,
- MSFG Trend: Up.
YSFG Year 2026
- Long-Term
- YSFG Current: 81%
- F0%/NTZ' Bias: Price Above,
- YSFG Trend: Up.
Swing Pivots
- (Short-Term) 1. Pvt. Trend: DTrend,
- (Intermediate-Term) 2. HiLo Trend: DTrend,
- 3. Pvt. Evolve: Pvt Low 67.04,
- 4. Pvt. Next: Pvt High 90.76,
- 5. Levels R: 105.90,
- 6. Levels S: 67.04, 45.29, 40.54, 39.70, 37.91.
Weekly Benchmarks
- (Short-Term) 5 Day: 73.85 Up Trend,
- (Short-Term) 10 Day: 80.32 Down Trend,
- (Intermediate-Term) 20 Day: 84.87 Down Trend,
- (Intermediate-Term) 55 Day: 68.54 Down Trend,
- (Long-Term) 100 Day: 58.68 Up Trend,
- (Long-Term) 200 Day: 56.48 Up Trend.
Recent Trade Signals
- 13 Jul 2026: Long CL 08-26 @ 74.69 Signals.USAR-MSFG
- 13 Jul 2026: Long CL 08-26 @ 74.52 Signals.USAR-WSFG
- 13 Jul 2026: Long CL 08-26 @ 74.39 Signals.USAR.TR120
- 08 Jul 2026: Long CL 08-26 @ 75.84 Signals.USAR.TR720
Overall Rating
- Short-Term: Bullish,
- Intermediate-Term: Bullish,
- Long-Term: Bullish.
Key Insights Summary
Crude oil is showing a strong recovery phase after a dramatic swing down from the 2026 highs, with the current weekly bar pushing back above the yearly and monthly F0%/NTZ structure. The short-term pivot structure is still marked DTrend because the latest major swing completed on the downside, but price has already reclaimed the lower pivot zone near 67.04, which now acts as a key reference level. Benchmarks are mixed in the middle of the stack, with the 5-day turning up while the 10-day, 20-day, and 55-day remain in down trends, reflecting a fast rebound inside a larger transition. The 100-day and 200-day remain in up trends, keeping the broader backdrop constructive. The recent cluster of long signals across WSFG, MSFG, and TR120 reinforces the current upside swing, while the larger price map points to the next major resistance context well above current trade near 90.76 and 105.90.
Chart Analysis ATS AI Generated: 2026-07-13 07:02 for Informational use only, not trading advice. Terms and Risk Disclosure Copyright © 2026. Algo Trading Systems LLC.