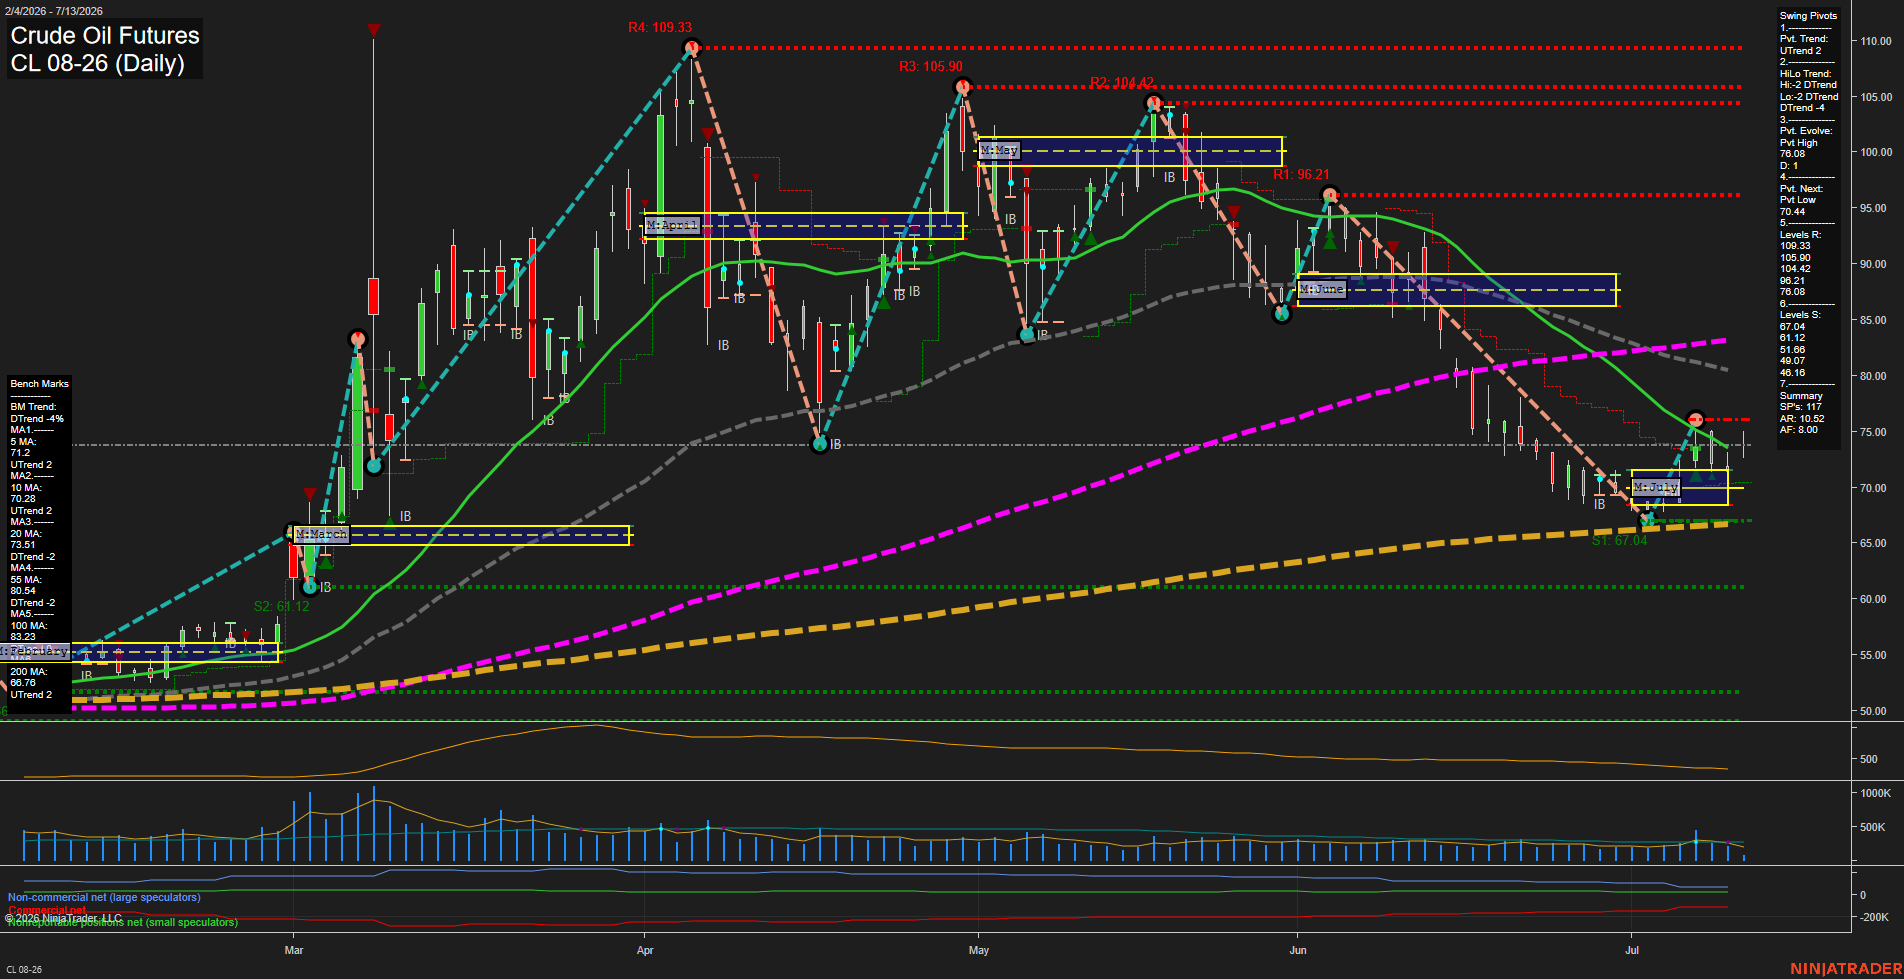
CL Crude Oil Futures Daily Chart Analysis: 2026-Jul-13 07:01 CT
Price Action
- Last: 74.69,
- Bars: Medium,
- Mom: slow.
WSFG Weekly
- Short-Term
- WSFG Current: 2%
- F0%/NTZ' Bias: Price Above,
- WSFG Trend: Up.
MSFG Month Jul
- Intermediate-Term
- MSFG Current: 15%
- F0%/NTZ' Bias: Price Above,
- MSFG Trend: Up.
YSFG Year 2026
- Long-Term
- YSFG Current: 81%
- F0%/NTZ' Bias: Price Above,
- YSFG Trend: Up.
Swing Pivots
- (Short-Term) 1. Pvt. Trend: UTrend,
- (Intermediate-Term) 2. HiLo Trend: DTrend,
- 3. Pvt. Evolve: Pvt High 76.08,
- 4. Pvt. Next: Pvt Low 70.44,
- 5. Levels R: 109.33, 105.90, 104.42, 96.21, 76.08,
- 6. Levels S: 67.04, 61.12, 51.68, 49.07, 46.52.
Daily Benchmarks
- (Short-Term) 5 Day: 71.2 Up Trend,
- (Short-Term) 10 Day: 70.28 Up Trend,
- (Intermediate-Term) 20 Day: 73.51 Down Trend,
- (Intermediate-Term) 55 Day: 80.54 Down Trend,
- (Long-Term) 100 Day: 83.23 Down Trend,
- (Long-Term) 200 Day: 68.76 Up Trend.
Additional Metrics
- ATR: 10.52,
- VOLMA: 345883.
Recent Trade Signals
- 13 Jul 2026: Long CL 08-26 @ 74.69 Signals.USAR-MSFG
- 13 Jul 2026: Long CL 08-26 @ 74.52 Signals.USAR-WSFG
- 13 Jul 2026: Long CL 08-26 @ 74.39 Signals.USAR.TR120
- 08 Jul 2026: Long CL 08-26 @ 75.84 Signals.USAR.TR720
Overall Rating
- Short-Term: Bearish,
- Intermediate-Term: Bearish,
- Long-Term: Neutral.
Key Insights Summary
Crude oil is in a broad corrective phase after a major mid-spring peak near 109.33 and a sequence of lower highs into July. The daily structure shows price holding above the weekly and monthly session grid biases, but the benchmark moving averages are still stacked bearishly in the intermediate and long horizons, with price below the 20, 55, and 100 day averages. Swing pivot structure remains mixed to negative: the short-term pivot trend is still marked UTrend, while the HiLo trend is DTrend, reflecting a fading recovery against the dominant downslope. The most recent action has been a measured selloff with consolidation around the low-70s, leaving 76.08 as the latest pivot high and 70.44 as the next pivot low marker. Overall, the chart reads as a retracement-driven market with compressed volatility, repeated rejection from overhead resistance, and a near-term trade range centered around the low-70s after the prior breakdown from the mid-80s and 90s area.
Chart Analysis ATS AI Generated: 2026-07-13 07:01 for Informational use only, not trading advice. Terms and Risk Disclosure Copyright © 2026. Algo Trading Systems LLC.