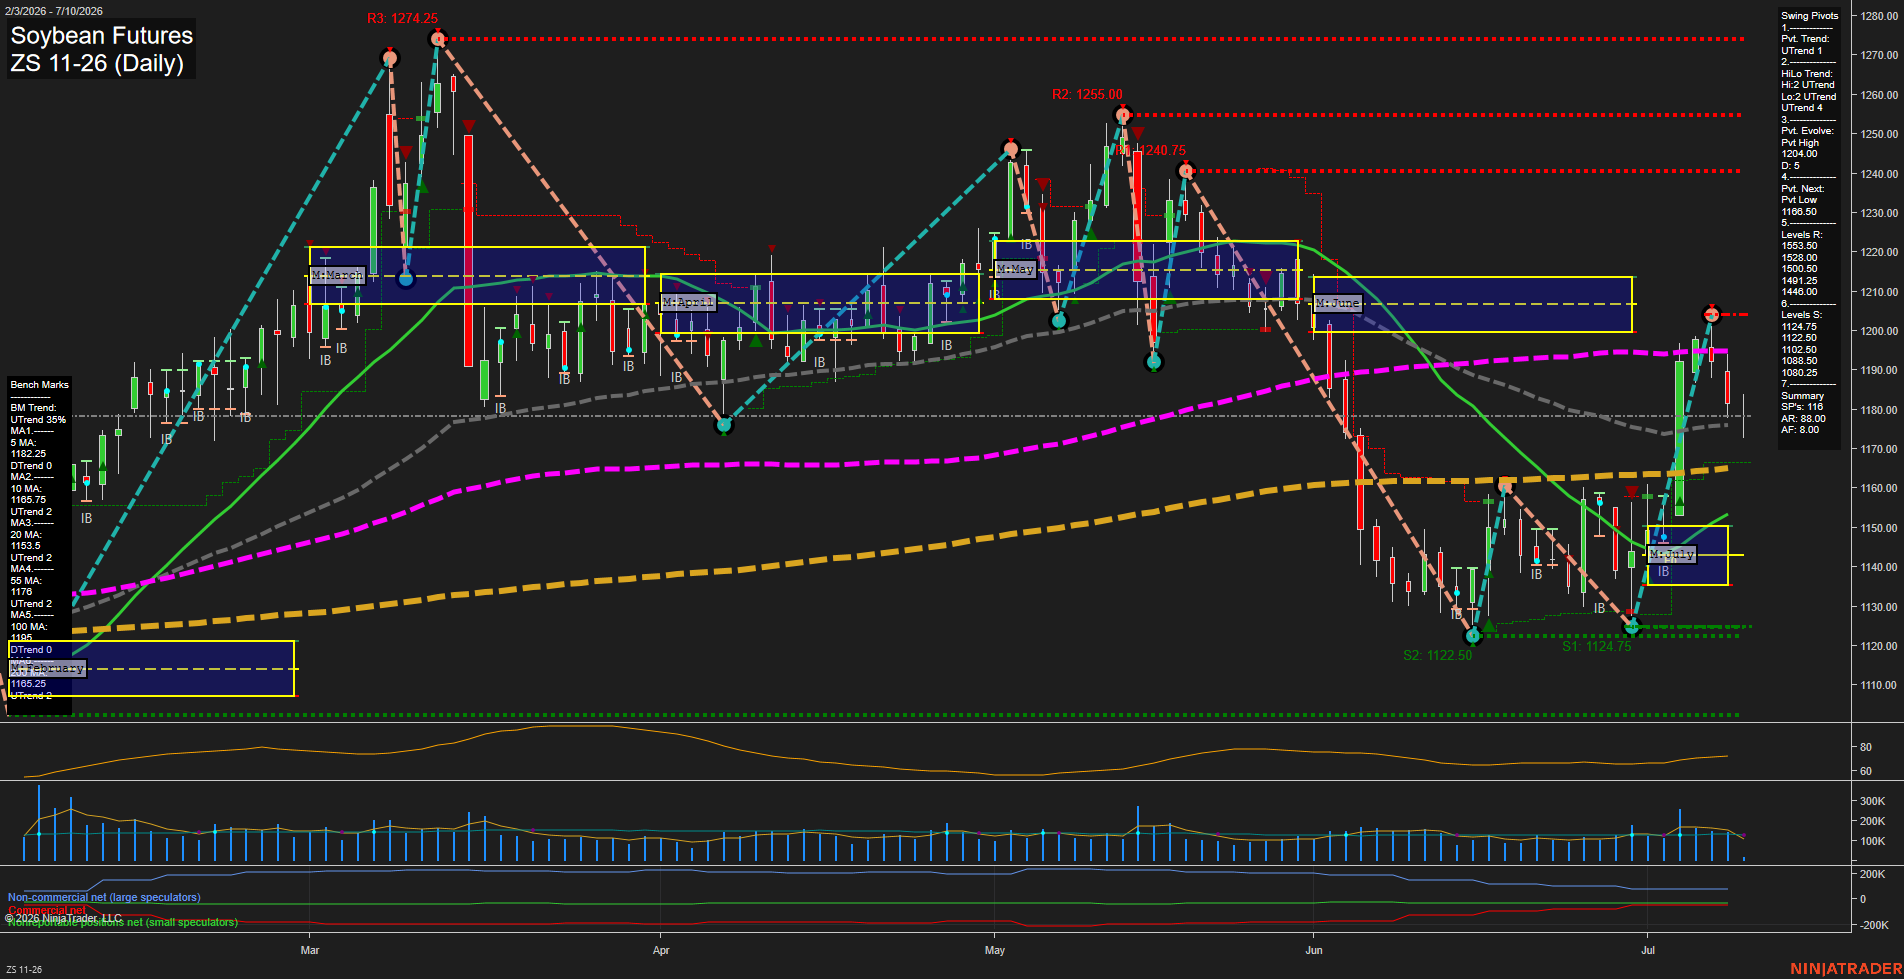
ZS Soybean Futures Daily Chart Analysis: 2026-Jul-10 07:09 CT
Price Action
- Last: 1178.50,
- Bars: Large,
- Mom: fast.
WSFG Weekly
- Short-Term
- WSFG Current: 78%
- F0%/NTZ' Bias: Price Above,
- WSFG Trend: Up.
MSFG Month Jul
- Intermediate-Term
- MSFG Current: 38%
- F0%/NTZ' Bias: Price Above,
- MSFG Trend: Up.
YSFG Year 2026
- Long-Term
- YSFG Current: 18%
- F0%/NTZ' Bias: Price Above,
- YSFG Trend: Up.
Swing Pivots
- (Short-Term) 1. Pvt. Trend: UTrend,
- (Intermediate-Term) 2. HiLo Trend: UTrend,
- 3. Pvt. Evolve: Pvt High 1204.00,
- 4. Pvt. Next: Pvt Low 1166.50,
- 5. Levels R: 1553.50, 1528.00, 1500.50, 1491.25, 1446.00,
- 6. Levels S: 1124.75, 1122.50, 1102.50, 1088.50, 1080.25.
Daily Benchmarks
- (Short-Term) 5 Day: 1182.25 Down Trend,
- (Short-Term) 10 Day: 1165.75 Up Trend,
- (Intermediate-Term) 20 Day: 1153.50 Up Trend,
- (Intermediate-Term) 55 Day: 1176.00 Up Trend,
- (Long-Term) 100 Day: 1195.00 Down Trend,
- (Long-Term) 200 Day: 1165.25 Up Trend.
Additional Metrics
Overall Rating
- Short-Term: Bullish,
- Intermediate-Term: Bullish,
- Long-Term: Neutral.
Key Insights Summary
Soybean futures are in a recovered uptrend after the sharp June selloff, with price lifting back above the monthly and weekly fib centers and holding above the intermediate benchmark cluster. The daily structure remains positive with an UTrend pivot profile, higher swing support still in place, and momentum showing a fast rebound from the early-July base. Near-term action is still working through the 5-day and 100-day overhead reference zones, so the tape looks more like a strong retracement within a broader transition than a clean runaway trend. The chart shows active rotation, repeated inside-bar digestion, and a recent thrust higher from the July low, which keeps the short-term bias constructive while the long-term picture stays mixed between the 100-day resistance and the lower major support band.
Chart Analysis ATS AI Generated: 2026-07-10 07:09 for Informational use only, not trading advice. Terms and Risk Disclosure Copyright © 2026. Algo Trading Systems LLC.