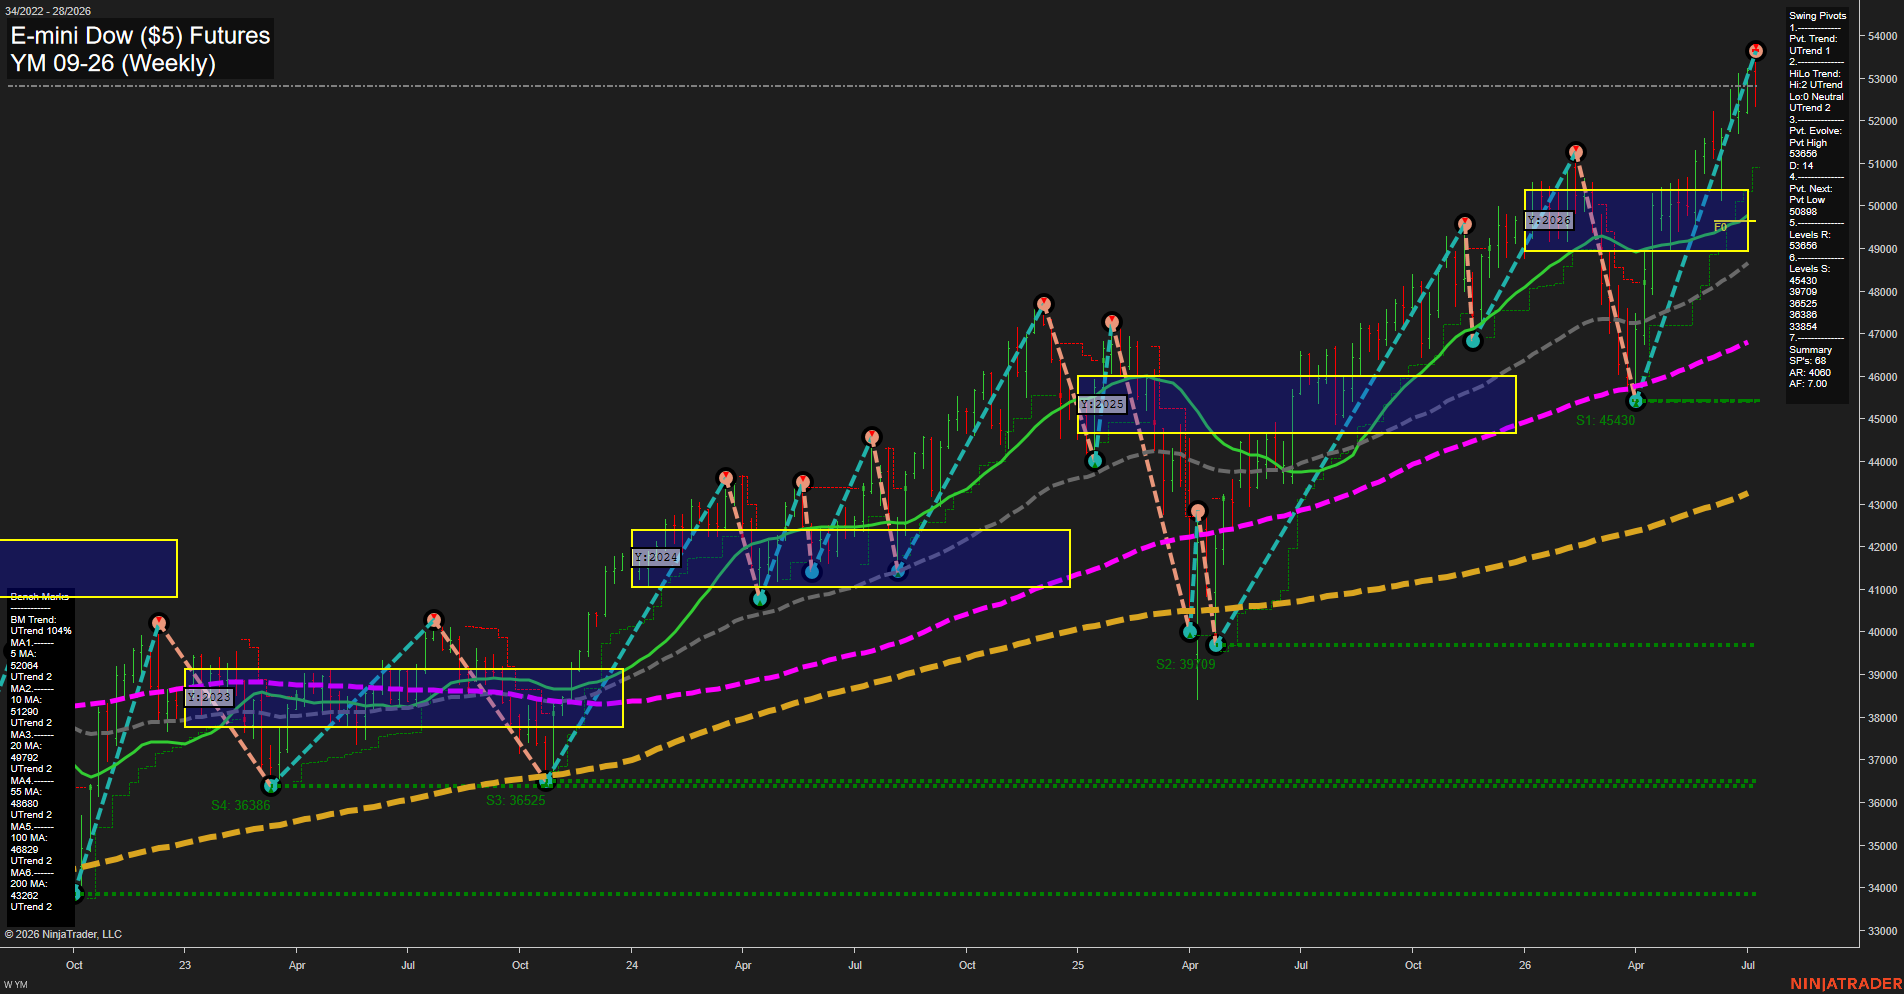
YM E-mini Dow ($5) Futures Weekly Chart Analysis: 2026-Jul-10 07:08 CT
Price Action
- Last: 53586,
- Bars: Large,
- Mom: fast.
WSFG Weekly
- Short-Term
- WSFG Current: -31%
- F0%/NTZ' Bias: Price Below,
- WSFG Trend: Down.
MSFG Month Jul
- Intermediate-Term
- MSFG Current: 11%
- F0%/NTZ' Bias: Price Above,
- MSFG Trend: Up.
YSFG Year 2026
- Long-Term
- YSFG Current: 44%
- F0%/NTZ' Bias: Price Above,
- YSFG Trend: Up.
Swing Pivots
- (Short-Term) 1. Pvt. Trend: UTrend,
- (Intermediate-Term) 2. HiLo Trend: UTrend,
- 3. Pvt. Evolve: Pvt High 53586,
- 4. Pvt. Next: Pvt Low 50898,
- 5. Levels R: 53586,
- 6. Levels S: 45430, 39709, 36525, 36386, 33854.
Weekly Benchmarks
- (Short-Term) 5 Day: 52064 Up Trend,
- (Short-Term) 10 Day: 51290 Up Trend,
- (Intermediate-Term) 20 Day: 49792 Up Trend,
- (Intermediate-Term) 55 Day: 48860 Up Trend,
- (Long-Term) 100 Day: 46829 Up Trend,
- (Long-Term) 200 Day: 43262 Up Trend.
Recent Trade Signals
- 08 Jul 2026: Short YM 09-26 @ 53057 Signals.USAR-WSFG
- 08 Jul 2026: Short YM 09-26 @ 53117 Signals.USAR.TR120
- 07 Jul 2026: Long YM 09-26 @ 53217 Signals.USAR-MSFG
Overall Rating
- Short-Term: Bullish,
- Intermediate-Term: Bullish,
- Long-Term: Bullish.
Key Insights Summary
Strong weekly upside continuation is in force, with price pushing to new swing highs near 53586 and holding well above all benchmark moving averages. The short-term WSFG is still below its F0%/NTZ midpoint and reads down, but the active swing pivot structure remains UTrend and the latest price action shows a powerful breakout leg that has reclaimed momentum after the prior pullback. Intermediate and long-term session grids both remain above their midlines, reinforcing the broader trend profile. The pivot map shows the next meaningful downside reference at 50898, while layered support remains much lower at 45430, 39709, 36525, 36386, and 33854. Recent signals reflect the transition from short bias to a higher-timeframe long bias, while the benchmark stack staying positively aligned supports an established trend regime with persistent higher highs and higher lows.
Chart Analysis ATS AI Generated: 2026-07-10 07:08 for Informational use only, not trading advice. Terms and Risk Disclosure Copyright © 2026. Algo Trading Systems LLC.